
FIGURE
Fig. 7
- ID
- ZDB-FIG-060410-20
- Publication
- Hammond et al., 2006 - The developing lamprey ear closely resembles the zebrafish otic vesicle: otx1 expression can account for all major patterning differences
- Other Figures
- All Figure Page
- Back to All Figure Page
Fig. 7
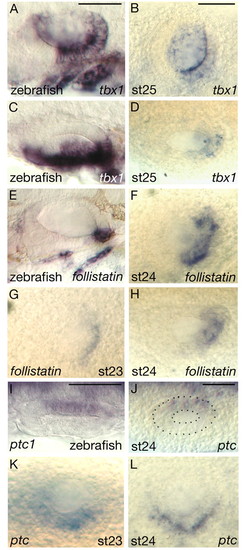
Comparison of mRNA expression patterns. (A-L) Comparison of the mRNA expression patterns of tbx1, follistatin and ptc in zebrafish and lamprey (P. marinus) otic vesicles. (A,C) 28 hpf zebrafish; (E) 30 hpf zebrafish; (I) 20 hpf zebrafish; all others are P. marinus at the stages shown. (C,D,H-J) Dorsal views, anterior to left, medial to top; all others are lateral views, anterior to left, dorsal to top. The otic vesicle is outlined in J for clarity. Scale bars: in A, 50 μm for A,C,E; in B, 50 μm for B,D,F-H,K,L; in I,J, 50 μm. |
Expression Data
| Genes: | |
|---|---|
| Fish: | |
| Anatomical Term: | |
| Stage Range: | 20-25 somites to Prim-15 |
Expression Detail
Antibody Labeling
Phenotype Data
Phenotype Detail
Acknowledgments
This image is the copyrighted work of the attributed author or publisher, and
ZFIN has permission only to display this image to its users.
Additional permissions should be obtained from the applicable author or publisher of the image.
Full text @ Development