
Fig. 2
- ID
- ZDB-FIG-060410-16
- Publication
- Hammond et al., 2006 - The developing lamprey ear closely resembles the zebrafish otic vesicle: otx1 expression can account for all major patterning differences
- Other Figures
- All Figure Page
- Back to All Figure Page
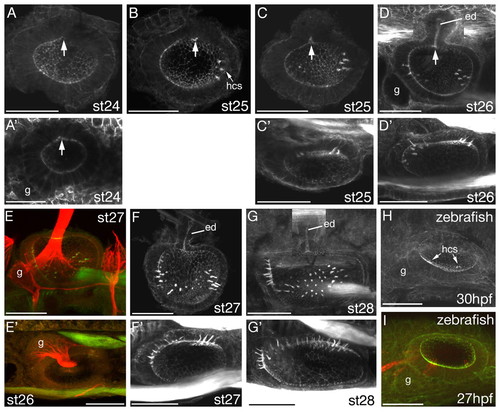
Early development of the lamprey otic vesicle. (A-I) Projections of confocal z-stacks of embryos stained with FITC-phalloidin, revealing the actin-rich stereocilia of the sensory hair bundles and the general morphology of the developing lamprey inner ear. All images are of L. fluviatilis, except for A' (L. planeri) and H,I (zebrafish). (A-I,A') Lateral views, anterior to the left, dorsal to the top; (C'-G') dorsal views, anterior to the left, medial to the top. (A-C,E,F) Partially dissected specimens; (D,G) composites of two images. Arrows indicate outpocketing of endolymphatic duct. g, statoacoustic (VIIIth) ganglion; ed, endolymphatic duct; hcs, sensory hair cells. (E,E',I) Double stains with FITC-phalloidin (green) and anti-acetylated tubulin (red) to reveal neuronal cell bodies and axonal projections of the statoacoustic ganglion (E,E') and sensory hair cell kinocilia (I). Stages are shown for each panel. Scale bars: 50 μm. |