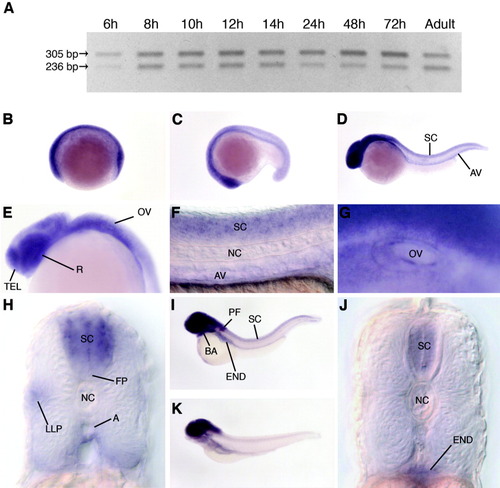
Expression of zebrafish ptena mRNA during embryogenesis. Expression of ptena was analyzed by RT-PCR and whole-mount in situ hybridization. A: Expression of ptena splice variants during zebrafish development determined by RT-PCR. Bands of 305 and 236 bp represent fragments of the long and short splice variants, respectively. B-K: Expression of ptena determined by whole-mount in situ hybridization. B: Early somitogenesis, lateral view. C: Mid-somitogenesis, lateral view. D: Twenty-four hpf, lateral view. E: Twenty-four hpf, lateral view of head. F: Twenty-four hpf, lateral view of tail. G: Thirty-six hpf, lateral view of otic vesicle. H: Twenty-four hpf, transverse section of trunk. I: Forty-eight hpf, lateral view. J: Forty-eight hpf, transverse section of trunk. K: Five dpf, lateral view. A, aorta wall; AV, axial vasculature; BA, branchial arches; END, endoderm; FP, floor plate; LLP, lateral line primordium; NC, notochord; OV, otic vesicle; PF, pectoral fin; R, retina; SC, spinal cord; TEL, telencephalon.
|
