
Fig. 4
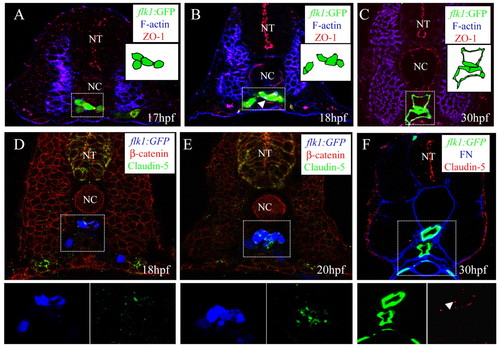
Junction formation between endothelial cells in the vascular cord. Transverse sections visualized for: (A-C) GFP (green), filamentous actin (blue) and ZO1 (red); (D,E) GFP (blue), claudin 5 (green) and ß-catenin (red); (F) GFP (green), fibronectin (blue) and claudin 5 (red). The sections shown are at the level of the 7th (A), 10th (B,D,E), and 14th (C,F) somites. Schematic drawings of the outlined areas are shown as insets (A-C). The GFP and claudin 5 signals of the outlined areas are shown separately as insets as blue and green channels, respectively (D,E) and green and red channels, respectively (F). Junctions form between endothelial cells after they reach the midline. NT, neural tube; NC, notochord. Arrowheads in B,F indicate ZO1 and claudin 5 localization, respectively. |