
Fig. S3
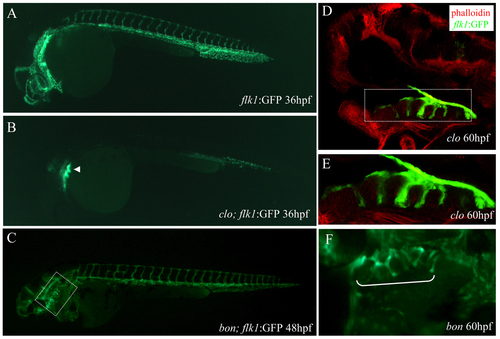
Pharyngeal expression of flk1:GFP in cloche and bonnie and clyde mutant embryos. Epifluorescence micrographs of a Tg(flk1:EGFP)s843;clo mutant embryo (B) and a sibling (A) at 36 hpf, and a Tg(flk1:EGFP)s843;bon mutant embryo at 48 hpf (C). The outlined area in C is shown in F. Longitudinal section of a clo mutant embryo at 60 hpf, visualized for GFP (green) and filamentous actin (red) (D). The outlined area in D is shown in E. White bracket in F marks the pharyngeal region. The pharyngeal GFP expression is present in Tg(flk1:EGFP)s843;clo mutant embryos (arrowhead in B; D,E), while severely reduced in Tg(flk1:EGFP)s843;bon mutant embryos (F), suggesting that it is localized in endodermal tissues. |