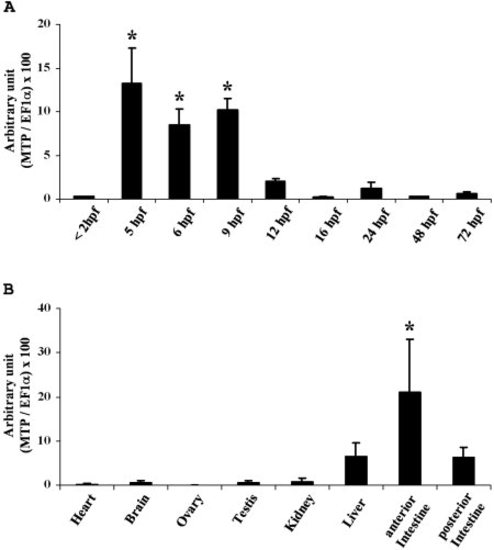
Real-time quantitative polymerase chain reaction (q-PCR) analysis of mtp expression in zebrafish. A: At each developmental stage, three independent pools of more than 50 embryos were used to quantify in duplicate mtp transcript amount. mtp expression was significantly higher at 5 hours postfertilization (hpf; 40% epiboly), 6 hpf (shield stage), and 8 hpf (80% epiboly) in comparison to the other developmental stages tested. B: Liver, anterior intestine, and posterior intestine were collected from three fed females and pooled. Heart, brain, testis, ovary, and kidney tissues were collected from more than 10 different animals and pooled. The q-PCR was performed on three independent pools in duplicate. mtp expression was significantly higher in the anterior intestine in comparison with the other collected tissues. The indicated values are the mean ± standard deviation of the ratio (microsomal triglyceride transfer protein large subunit copy number/elongation factor 1 α transcript [MTP/EF1α] copy number) × 100. Data were tested for statistical significance by analysis of variance followed by an evaluation using the Tukey-Kramer test. Asterisks indicate P < 0.05.
|
