
- Title
-
Developmental expression and nutritional regulation of a zebrafish gene homologous to mammalian microsomal triglyceride transfer protein large subunit
- Authors
- Marza, E., Barthe, C., André, M., Villeneuve, L., Hélou, C., and Babin, P.J.
- Source
- Full text @ Dev. Dyn.
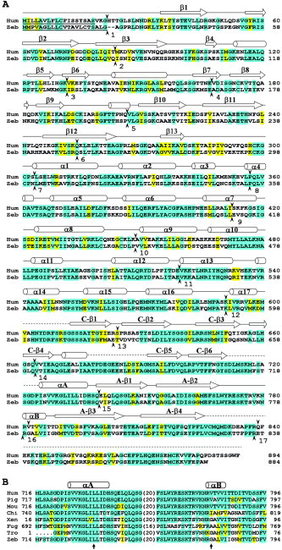
Comparison between fish and tetrapods microsomal triglyceride transfer protein (MTP) large subunit predicted amino acid sequences. Amino acid sequences are numbered from the initiator methionine for human (Hum), pig (Pig), mouse (Mou), chicken (Chi), Fugu (Fug), and zebrafish (Zeb) sequences. Xenopus (Xen) and trout (Tro) sequences are numbered according to the amino acid sequence deduced from the partial cDNA sequences currently available. Residues identical or considered conserved with human sequence are colored in cyan and yellow, respectively. The allowed conservative substitutions were defined as follows: A, G; S, T; E, D; R, K, H; Q, N; V, I, L, M; Y, F; W; P; C. A: Zebrafish MTP large subunit predicted amino acid sequence aligned with the corresponding human sequence. The predicted signal peptide sequences are underlined. Human MTP-predicted structure based on the atomic coordinates of lamprey lipovitellin (Mann et al.,[1999]; Read et al.,[2000]) is shown with arrows indicating β-strands, cylinders depicting α-helices, plain lines representing loops, and dashed lines the unassigned coordinates. Human MTP large subunit is structurally divided into four domains: the N-sheet (β1-β13) consists of amino acids 22 to 303, the α-helical domain (α1-α17) is distributed from amino acids 304 to 598, the C-sheet (C-β1-C-β6) corresponds to the fragment between amino acids 603 and 712, and the A-sheet (αA-A-β4) includes amino acids 725 to 829. Downward and upward black arrowheads indicate intron positions in human and zebrafish MTP large subunit gene, respectively. The number below the zebrafish sequence and attached to the upward black arrow is indicative of the intron number. Gaps inserted to optimize alignments are indicated by dashes. B: Comparison of the C-terminal part of vertebrate MTP large subunit protein sequences encompassing helices αA and αB of the A-sheet domain of human MTP large subunit. Single dots in the trout sequence indicate an unknown sequence. Numbers in parentheses in the alignments indicate the length of the omitted sequence. Arrows below the sequences indicate two amino acid positions critical for the lipid transfer activity of human MTP large subunit (Read et al.,2000]). The first position corresponding to leucine-734 is conserved in the other vertebrate sequences, whereas the second position corresponding to valine-782 is not. |
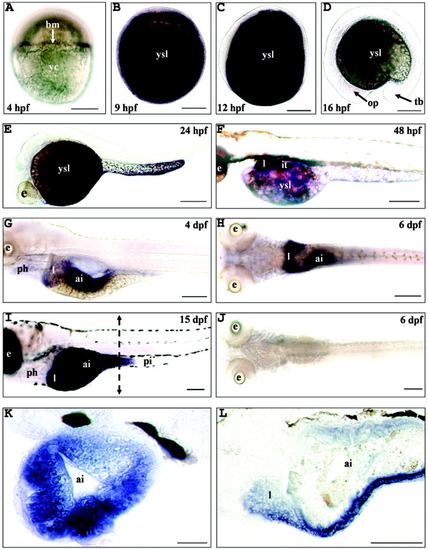
Expression pattern of the microsomal triglyceride transfer protein (MTP) large subunit gene (mtp) during zebrafish embryonic and larval development. A: After the mid-blastula transition, 4 hours postfertilization (hpf). B: During the gastrulation period (9 hpf). C: At the five-somite stage (12 hpf). D: At the 15-somite stage (16 hpf). E: A 24-hpf embryo. F: A 48-hpf embryo. G: A 4 days postfertilization (dpf) larva. H,J: A 6 dpf larva. I,K,L: A15 dpf larva. Whole-mount in situ hybridizations were performed with digoxigenin-labeled sense and antisense riboprobes and are presented in lateral (A-G,I) or dorsal (H,J) views with the anterior part to the left (C-J,L). The 6-dpf and 15-dpf larvae were nourished ad libitum. In some cases (G,H,J), the animals were raised in 0.2 mM 1-phenyl-2-thio-urea containing water to prevent pigment formation. The hybridization signal is colored dark brown to blue. J: No staining signal was observed by using the sense probe. A: A specific hybridization signal was first observed in the blastoderm margin (bm). B-F: mtp was then strongly expressed in the yolk syncytial layer (ysl) from the end of the gastrulation period until 48 hpf. C-E: No transcripts were detected in embryonic structures until 24 hpf. F: At 48 hpf, mtp mRNA was detected in the liver (l), intestinal tube (it), and yolk syncytial layer. G: By 4 dpf, the hybridization signal was restricted to the liver and anterior intestine (ai). H: By 6 dpf, the two liver lobes and the anterior intestine were strongly labeled. I: By 15 dpf, mtp mRNA was detected in the liver and the anterior intestine, including the intestinal bulb, while no hybridization signal could be detected in pharynx (ph) and posterior intestine (pi). Transverse (K), indicated by a vertical broken line in (I), and parasagittal (L) cryosections of 15-dpf larvae showed that mtp transcripts were restricted to enterocytes and hepatic cells. Embryos, larvae, and cryosections were mounted in 100% glycerol. yc, yolk cell; op, optic primordium; tb, tail bud; e, eye. Scale bars = 100 μm in A-D,F-L, 500 μm in E. EXPRESSION / LABELING:
|
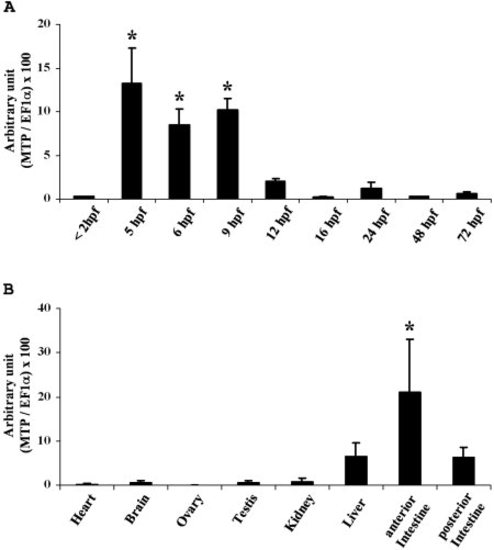
Real-time quantitative polymerase chain reaction (q-PCR) analysis of mtp expression in zebrafish. A: At each developmental stage, three independent pools of more than 50 embryos were used to quantify in duplicate mtp transcript amount. mtp expression was significantly higher at 5 hours postfertilization (hpf; 40% epiboly), 6 hpf (shield stage), and 8 hpf (80% epiboly) in comparison to the other developmental stages tested. B: Liver, anterior intestine, and posterior intestine were collected from three fed females and pooled. Heart, brain, testis, ovary, and kidney tissues were collected from more than 10 different animals and pooled. The q-PCR was performed on three independent pools in duplicate. mtp expression was significantly higher in the anterior intestine in comparison with the other collected tissues. The indicated values are the mean ± standard deviation of the ratio (microsomal triglyceride transfer protein large subunit copy number/elongation factor 1 α transcript [MTP/EF1α] copy number) × 100. Data were tested for statistical significance by analysis of variance followed by an evaluation using the Tukey-Kramer test. Asterisks indicate P < 0.05. |
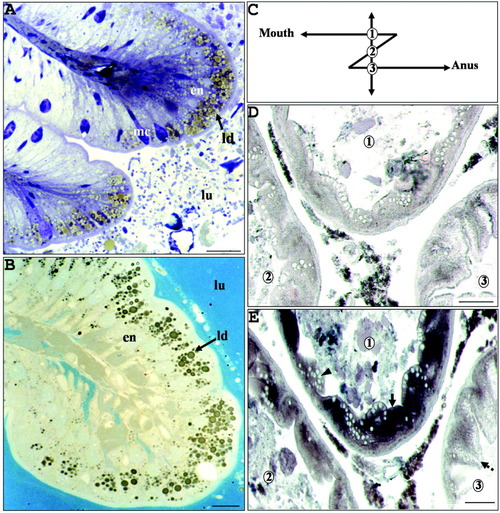
Intestinal mucosa of fed adult zebrafish. A,B: Histological semithin sections of the anterior intestine were stained with toluidine blue (A) or with the neutral lipid-specific stain Sudan black B (B). In both cases, the intestinal mucosa showed enterocytes (en) containing large lipid droplets (ld). C: Schema of adult zebrafish intestine. From the mouth to the anus, two intestinal loops are observed and transverse sections at loop levels give three different intestinal rings, numbered 1 to 3. D,E: The localization of mtp transcripts was performed in the intestine by in situ hybridizations with digoxigenin-labeled sense (D) and antisense (E) riboprobes on parallel transverse intestinal sections of an 8-month fed young adult female at the level indicated by a vertical line in C. Rings 1 and 2 are representative of the proximal and distal parts of the anterior intestine, respectively. Ring 3 could be attributed to the posterior part of the intestine due to the presence of a large amount of vacuoles in the supranuclear hyaloplasm (arrow with broken line) of enterocytes. No staining signal was observed by using the sense probe. A strong mtp hybridization signal was observed at ring 1 and, to a lesser extent, at rings 2 and 3. The staining signal was restricted to the enterocytes (arrow), whereas the mucous cells (arrowhead) were not labeled. lu, lumen; mc, mucous cells. Scale bars = 30 μm in A, 15 μm in B, 100 μm in D,E. |
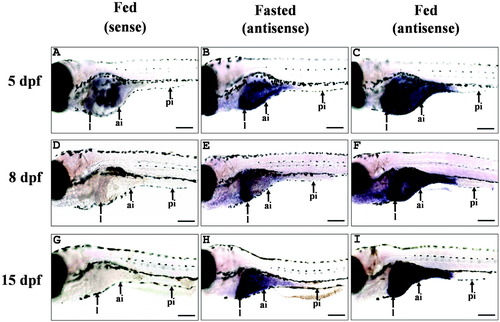
The effect of feeding on mtp expression in zebrafish larvae as evaluated by whole-mount in situ hybridization. A-I: Larvae were fasted for 18 hr and fed (A,C,D,F,G,I) or not (B,E,H) with dried chicken egg yolk powder for 2 hr. A-I: The 5 days postfertilization (dpf; A-C), 8 dpf (D-F), and 15 dpf (G-I) larvae were then collected and hybridized with sense (A,D,G) or antisense riboprobes (B,C,E,F,H,I). Larvae are shown in lateral view with the anterior part to the left. B,C,E,F,H,I: At each developmental stage, mtp expression in the anterior intestine (ai) dramatically rose in fed larvae (C,F,I) compared with fasted larvae (B,E,H). mtp hybridization signal also appears to be increased in the liver (l). No transcripts could be detected in the posterior intestine (pi). A,D,G: No staining signal has been observed using the control sense probe. Scale bars = 500 μm. EXPRESSION / LABELING:
|
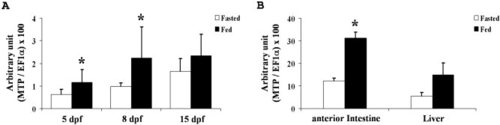
The effect of feeding on mtp transcript level in zebrafish as evaluated by real-time quantitative polymerase chain reaction. A: Larvae were fasted for 18 hr and fed or not with dried chicken egg yolk powder for 2 hr. At each developmental stage (dpf, days postfertilization), seven independent pools of more than 30 larvae were used to quantify in duplicate mtp transcript amount. B: Male adult zebrafish were starved for 18 hr and fed or not for 2.5 hr. At each experimental sample, anterior intestine and liver were collected from two animals and pooled. mtp transcript amounts were determined on seven independent samples in duplicate. The indicated values are the mean ± standard deviation of the ratio (microsomal triglyceride transfer protein large subunit copy number/elongation factor 1 α transcript [MTP/EF1α] copy number) × 100. Data were tested for statistical significance by performing a Mann-Whitney test. Asterisks indicate P < 0.05. |