
- Title
-
Equivalence in the genetic control of hindbrain segmentation in fish and mouse
- Authors
- Moens, C.B., Cordes, S.P., Giorgianni, M.W., Barsh, G.S., and Kimmel, C.B,
- Source
- Full text @ Development
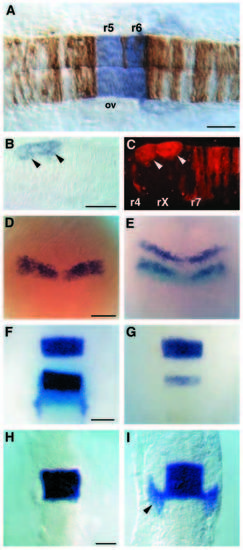
val expression during hindbrain segmentation. (A) val mRNA expression at the 18 somite stage (18 h; blue staining) corresponds to the domain in which val function is required as determined by genetic mosaic analysis in which valb337 cells (brown) were transplanted into the hindbrain region of a wild-type host embryo at the early gastrula stage (Moens et al., 1996). Dorsal view, with anterior to the left. ov: otic vesicle. (B,C) Transmitted and fluorescent images of a genetic mosaic embryo in which cells fom a wild-type embryo were transplanted into a valb337 host at the early gastrula stage. val expression (blue staining in B) is restricted to wild-type cells (marked by red fluorescence in C) that form abnormal clumps in rX of a valb337 host embryo (arrowheads). Dorsal view, anterior to the left. (D-I) val expression in wild-type and valb337 embryos in dorsal view with anterior to the top. (D) Earliest val expression is at bud stage (10 h) in a broad band in the neural plate. (E) Double in situ hybridization at the same stage showing krox-20 expression in the presumptive r3 and r5 (dark purple), and val expression (light blue) extending posterior to the r5-specific band of krox20. (F,G) Double in situs at the 10 somite stage (14 h) in wildtype (F) and valb337 (G) embryos, which can be distinguished by the near-absence of krox20 expression (dark purple) in r5 of valb337 embryos (Moens et al., 1996). val expression (light blue) corresponds to r5 and r6 in wild-type embryos (F) but no expression is observed in valb337 embryos (G). (H) val expression in a wild-type embryo at 10 somites is restricted to r5 and r6 but is not yet observed in neural crest cells migrating into the third pharyngeal arch (compare to krox20 expression in these cells at the same stage in F). (I) By the 14 somite stage (16 h) val expression is observed in r5 and r6 and in neural crest cells migrating into the third arch (arrowhead). Scale bars in A-C, F-H = 50 μm; D,E = 100 μm. EXPRESSION / LABELING:
|
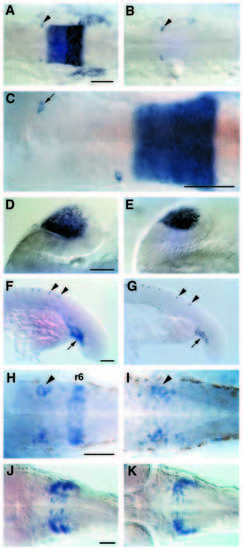
Other sites of val expression in wild-type and val- embryos. All embryos are shown in dorsal view with anterior to the left except F,G which are lateral views. (A,B) At the 20 somite stage (19 h), val expression begins to be down-regulated, first in r5 and then in r6, and expression is first detected in a bilateral pair of cells in r4 (arrowheads). In valb337 embryos (B) the r5/6 expression is absent but expression in these two cells occurs normally. (C) In this embryo, the right Mauthner cell was transplanted from r4 to r2 at the 12 somite stage (15 h), and val expression was detected at 19 h. The correlation of val expression with the transplanted cell (arrow) demonstrates that the bilateral pair of val-expressing cells in r4 are the Mauthner cells. (D,E) val expression in the lens in wild-type (D) and valb337 embryos (E) at 19 h. (F,G) val expression in Rohon- Beard cells (arrowheads) and in the blood-forming region at the base of the hind-yolk (arrow) in wild-type (F) and valb337 (G) embryos. (H,I) By 24 h, val expression is gone from r5 in both wild-type (H) and valb337 (I) embryos but persists at low levels in r6 in wild-type embryos. Expression in r4 is no longer restricted to the Mauthner cell but now includes 10-15 cells in a lateral cluster (arrowhead). In valb337 embryos at this stage (I) val expression is similarly upregulated in r4, but the cluster of val-expressing cells extends further caudally than in wild-type embryos (arrowhead). (J,K) val expression in the hindbrain of 42 h wild-type (J) and valb337 (K) embryos. Scale bars = 50 μm. EXPRESSION / LABELING:
|
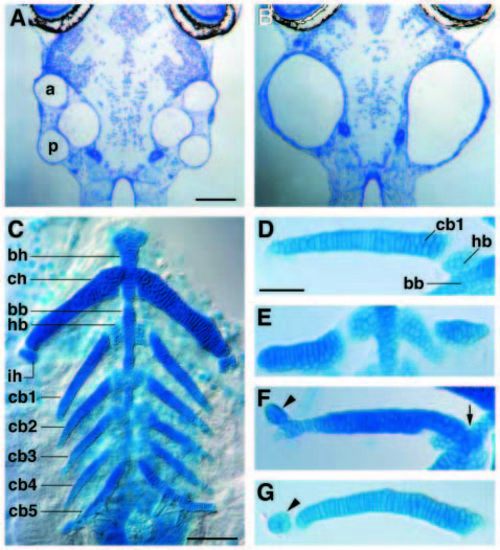
Inner ear and pharyngeal arch defects in val- larvae. (A,B) Horizontal sections of 5-day wild-type (A) and valb337 (B) larvae showing complete fusion of the developing semi-circular canals in the mutant. Anterior is to the top. This phenotype was observed with varying severity in 21/22 valb337 larvae examined, and 13 of these 22 mutant larvae circled in response to a gentle touch to the side of the head rather than swimming away in a straight line (1/50 wild-type larvae exhibited this behaviour). a and p indicate anterior and posterior semi-circular canals, respectively. (C-G) Alcian-blue stained pharyngeal arch-derived cartilages of 7- day wild-type (C, D) and valb337 (E-G) larvae. (C) The ventral cartilages of pharyngeal arches 2-7 in ventral view with anterior to the top. The second (hyoid) arch elements include paired ceratohyals (ch) and interhyals (ih). Medially, ch overlies the unpaired median basihyal (bh). The third through seventh (gill-bearing) arches each include paired ceratobranchials (cb1-5) and hypobranchials (hb1 labelled) which are adjacent to the unpaired median basibranchial (bb). (D) The third arch-derived cartilages of a wild-type embryo, dissected away from the surrounding tissue. Abbreviations are as for C. Note that cb1 is a tapering element, one cell wide through most of its length, and that it is separated from the median bb by hb1. (E-G) Third arch-derived cartilage elements of three valb337 larvae, with abnormalities including variable thickening and truncation (E,F); ectopic interhyal-like elements that are partially fused to (F; arrowhead) or separate from (G; arrowhead) cb1; and medial extensions of cb1 such that cb1 overlies bb (F; arrow). Scale bars in A-C = 100 μm D-G = 50 μm. |
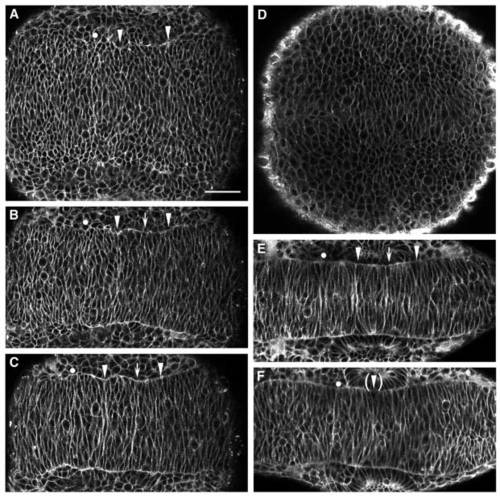
Time-lapse analysis of rhombomere boundary formation. (A-C) Confocal time-lapse images of a single BODIPY-stained embryo at approximately 6 somites (12 h; A), 8 somites (13 h; B) and 10 somites (14 h; C), in dorsal view with anterior to the right. During this interval, the r5/6 boundary becomes visible (arrow) between the r4/5 and r6/7 boundaries (arrowheads). (D) Bud-stage embryo (10 h), with no visible rhombomere boundaries. (E,F) Wild-type (E) and valb337 (F) embryos at 12 somites (15 h), demonstrating that the r5/6 boundary fails to form in valb337 embryos. An r4/rX boundary is initiated, although it is never morphologically visible (Moens et al., 1996). In all panels, the r3/4 boundary is marked by a dot, the r4/5 and r6/7 boundaries by arrowheads, and the r5/6 boundary by an arrow. Scale bars = 50 μm. PHENOTYPE:
|