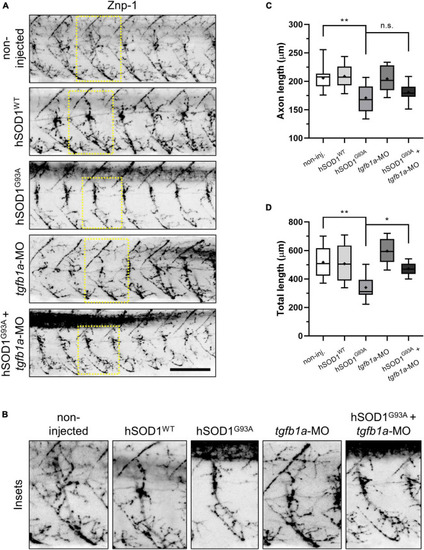
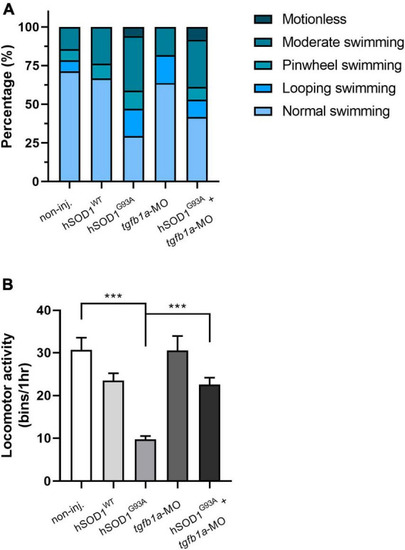
Knockdown of tgfb1a partially prevents motor axon abnormalities in hSOD1G93A-expressing zebrafish embryos. (A,B) Zebrafish embryos at the one-cell stage were subjected to microinjection with hSOD1WT mRNA (n = 10), hSOD1G93A mRNA (n = 12), tgfb1a-MO (n = 8), or co-microinjected with hSOD1G93A mRNA and hSOD1G93A mRNA (n = 9). Additionally, a non-injected group (n = 12) served as a control. At 48 hpf, the embryos were immunostained with Znp-1 antibody, and motor axon morphology was analyzed using ImageJ software with NeuronJ plugin, as previously described (Meijering et al., 2004; Robinson et al., 2019). The graphs depict quantifications of (C) axon length and (D) total length of motor axons (5–7 motor axons per embryo). Box and whisker plots represent the 25th and 75th percentiles, with medians represented by bisecting lines and means denoted by “+.” Whiskers indicate extreme values. Statistical differences were assessed using one-way ANOVA and Tukey’s multiple comparison test, *p < 0.05, **p < 0.01, n.s.: not significant. Scale bar: 100 μm.

Knockdown of tgfb1a partially prevents locomotor deficits in hSOD1G93A-expressing zebrafish larvae. At 48 hpf, zebrafish embryos from the following experimental groups: non-injected (n = 14), hSOD1WT mRNA (n = 14), hSOD1G93A mRNA (n = 19), tgfb1a-MO (n = 11) and hSOD1G93A mRNA + tgfb1a-MO (n = 11), underwent a (A) touch-evoked response assay, involving slight mechanical stimulation with subsequent evaluation and scoring of swimming behavior as normal swimming, looping swimming, pinwheel swimming or motionless. The graph depicts the percentage of each swimming type for the different experimental conditions. (B) Spontaneous locomotor activity was assessed in the same experimental groups as in A. At 48 hpf, each zebrafish embryo was placed into a single well of a 96-well plate, and their spontaneous locomotor activity was measured over 1 h using the automated Microtracker system, as previously described (Simonetta and Golombek, 2007; Paredes-Zúñiga et al., 2019). The values in B correspond to the mean ± SEM. Statistical differences were assessed using one-way ANOVA and Tukey’s multiple comparison test, ***p < 0.001.

Acknowledgments
This image is the copyrighted work of the attributed author or publisher, and ZFIN has permission only to display this image to its users. Additional permissions should be obtained from the applicable author or publisher of the image. Full text @ Front. Cell. Neurosci.