
- Title
-
Deficiency of mastl, a mitotic regulator, results in cell detachment from developing tissues of zebrafish embryos
- Authors
- Utsumi, H., Yabe, T., Koshida, S., Yamashita, A., Takada, S.
- Source
- Full text @ Front Cell Dev Biol
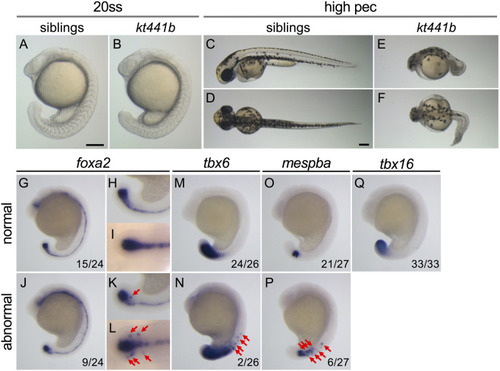
Phenotypes of |
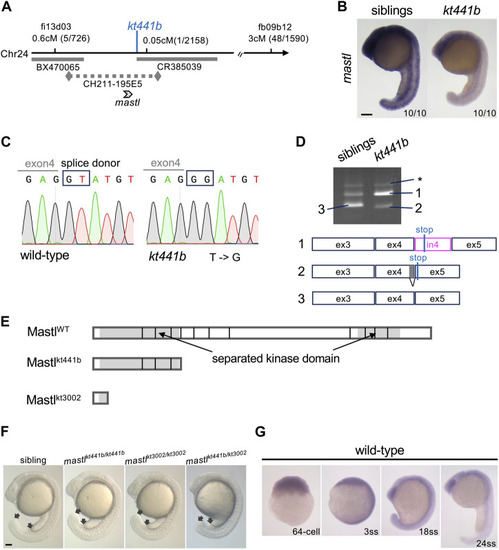
Identification of |
|
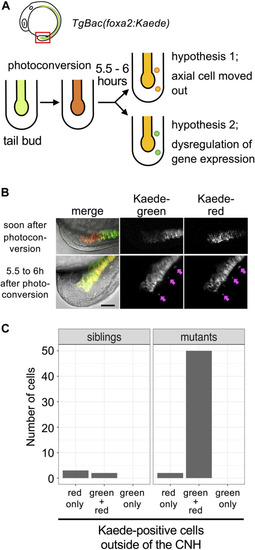
Detachment of CNH cells in |
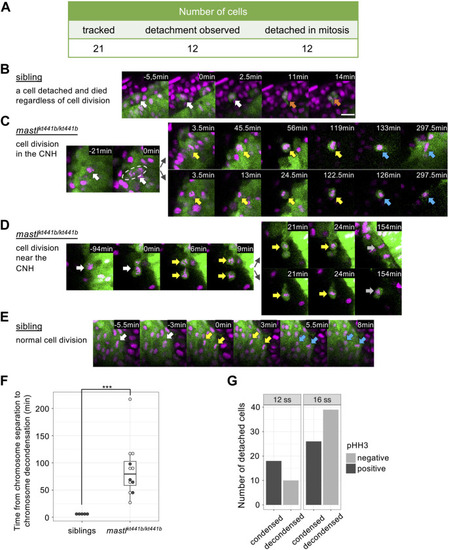
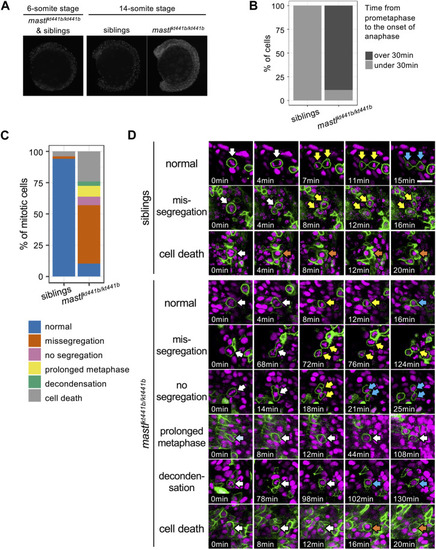
Cell detachment is related to aberrant mitosis in |
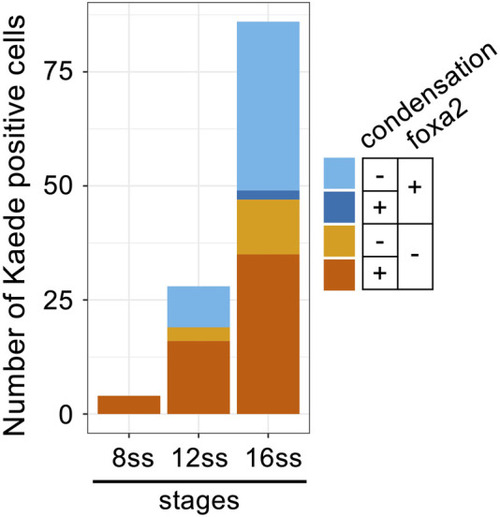
Decondensation of chromosomes and re-expression of |