FIGURE SUMMARY
Title

In vivo screening for toxicity-modulating drug interactions identifies antagonism that protects against ototoxicity in zebrafish

Authors
Bustad, E., Mudrock, E., Nilles, E.M., Mcquate, A., Bergado, M., Gu, A., Galitan, L., Gleason, N., Ou, H.C., Raible, D.W., Hernandez, R.E., Ma, S.
Source
Full text @ Front Pharmacol

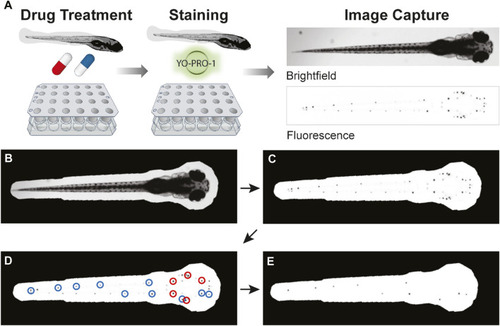
Overview of PEPITA workflow. (A) Zebrafish at 5dpf are placed into custom-made strainers in multi-well plates to be drug-treated and stained. After drug treatment for 4 h and YO-PRO-1 staining for 20 min, fish are anesthetized and imaged in brightfield and fluorescent channels. The resulting images are then quantified and analyzed. (B–E) An overview of PEPITA’s processing steps for quantifying whole-organism zebrafish image data. PEPITA accepts as input brightfield and fluorescence images of each organism. An additional fluorescence channel with no fluorophore present can also be optionally supplied, in which case PEPITA will use it as a baseline to cancel out autofluorescence in the image of fluorescently labeled neuromasts. (B) PEPITA creates a mask by automatically locating the larva by contrast, size, and shape from the brightfield image (which can be overridden manually when necessary). (C) This mask is applied to the fluorescence image in order to identify the points of interest. (D) PEPITA next identifies the 15 brightest local maxima within the masked region, excludes the top five (marked here in red), and creates a second mask obscuring everything except small circles (with a radius of 8 pixels by default) around the other ten puncta (marked here in blue). (E) This second mask is then reapplied to the fluorescence image, and the unobscured pixel values that exceed background level are summed to yield the raw fluorescence score for the given larva.

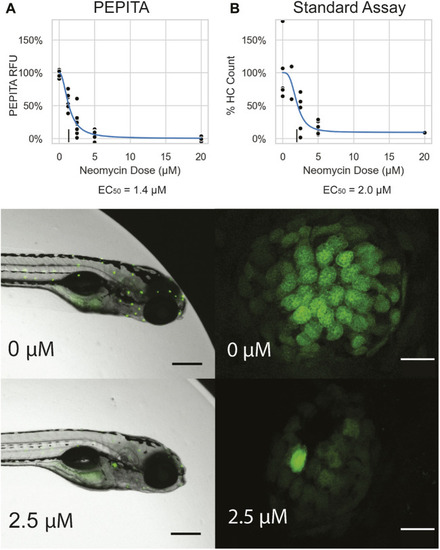
Characterization of single drug dose response with PEPITA. (A) Images and quantification of neomycin dose response from a representative experiment, using PEPITA (A) and the standard approach of counting HCs from individual neuromasts (B). All fish featured in this figure were treated and characterized in the same experiment. Top: dose-response curve generated by the PEPITA workflow with relative fluorescence units (RFU) (EC50 = 1.4 μM, left) shows similar properties to the dose response curve derived by enumerating normalized HC counts from individual neuromasts using procedure described in Section 2.3 (EC50 = 2.0 μM, right). (A) middle: representative image of a fish exposed to no drug, which is used for PEPITA quantification; (B) middle: representative image of an individual neuromast from a fish that was exposed to no drug, used for HC counting. (A) bottom: representative image of a fish exposed to 2.5 μM NEO, which is used for PEPITA quantification; (B) bottom: representative image of an individual neuromast from a fish that was exposed to 2.5 μM NEO, used for HC counting. Note that PEPITA uses the image of the whole fish for quantification, whereas the images have been cropped in these panels to faciliate visual inspection of the stained neuromasts. Scale bars in fish images represent 300 μm, and scale bars in neuromast images represent 10 μm.

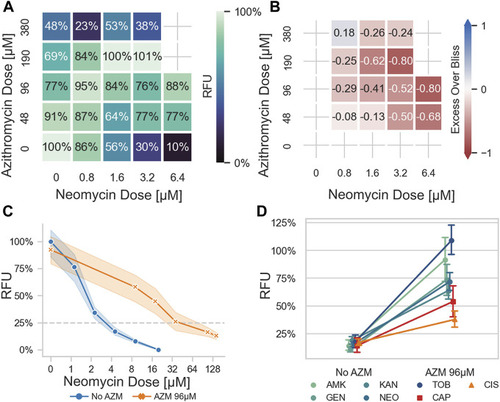
Azithromycin antagonizes aminoglycoside-induced ototoxicity in a zebrafish model. (A) Response seen when fish were exposed to increasing concentrations of azithromycin (AZM) and neomycin (NEO) in checkerboard format, as quantified by PEPITA in relative fluorescence units (RFU). Fish exposed to a combination of AZM and NEO experienced less ototoxic damage than those exposed to NEO alone, at all significantly ototoxic doses of NEO (i.e., ≥1.6 μM) and AZM doses up through 190 μM. In an extreme case, a dose of 6.4 μM NEO, causing 90% HC damage (10% RFU), is reduced to minimal damage (88% RFU) by the addition of 96 μM AZM. (B) excess over Bliss values calculated for the previous checkerboard data: positive numbers indicate synergy, negative numbers antagonism. The trend of reduced damage seen in the checkerboard translates to consistent antagonism, with an overall wEOB of −0.36 for this experiment. (C) Comparison of lateral line HC ototoxic dose response elicited by NEO with vs. without AZM co-administration (96 μM). (D) Comparison of lateral line HC damage in response to ototoxic drug exposure with vs. without AZM co-administration (96 μM). Drugs tested: AMK = amikacin, GEN = gentamicin, KAN = kanamycin, NEO = neomycin, TOB = tobramycin, CAP = capreomycin, CIS = cisplatin. Doses of drugs tested were selected to elicit 70%–95% hair cell damage in the absence of AZM co-administration. Aminoglycosides as a group are more antagonized than the non-aminoglycoside drugs tested (p < 0.0001).

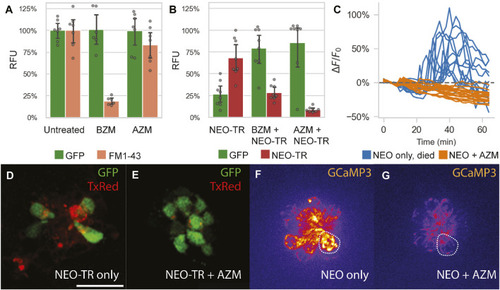
Impact of azithromycin and neomycin treatment on hair cell function. (A) AZM (190 µM) does not significantly hinder FM1-43 uptake into lateral line HCs (p = 0.15), as quantified by PEPITA. This suggests that AZM does not inhibit MET function. In contrast, administration of the MET inhibitor benzamil (BZM; 50 µM) as a positive control does significantly reduce FM1-43 uptake (p < 0.0001). (B) Effect of AZM (190 µM) co-administration on accumulation of TexasRed-conjugated neomycin (NEO-TR, 50 μM exposure) within myo6b::gfp lateral line HCs, as quantified by PEPITA. BZM (50 µM) co-administration with NEO was also evaluated as a positive control, and both conferred inhibition of NEO-TR uptake into the hair cells (BZM, p = 0.001; AZM, p = 0.0001). (D and E) Representative fluorescence microscopy images of the colocalization of NEO-TR (TexasRed (TxRed), red) with GFP-expressing HCs (GFP, green), treated with NEO-TR alone (D) or with both NEO-TR and AZM (E) for 30 min, after washout, not used for quantification of NEO-TR accumulation or GFP fluorescence levels. (C) Quantification of mitochondrial Ca2+ levels in individual HCs in response to NEO treatment alone (blue) or NEO plus AZM co-administration (orange), as measured by mitoGCaMP3 fluorescence signal. Drugs were administered at t = 10 min; (F and G) Fluorescence microscopy images of mitoGCaMP3 neuromasts at 30 min post drug administration, treated with NEO alone (F) or with both NEO and AZM (G). Scale bar for panels (D–G) represents 20 µm. The dashed shapes in panels F and G depict example regions of interest (ROI) used to quantify fluorescence signal.

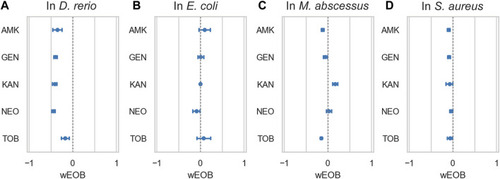
Azithromycin and aminoglycosides do not interact antagonistically in bacteria. (A) depicts ototoxic interactions in zebrafish as measured by PEPITA, while the subsequent three panels depict interactions as measured by checkerboard assay with the given bacterium, respectively: (B)E. coli, (C)M. abscessus, and (D)S. aureus. The x-axis quantifies the windowed excess over Bliss metric (wEOB), which measures drug interactions with negative numbers indicating antagonism and positive numbers indicating synergy. The y-axis contains 5 aminoglycoside antibiotics. None of the measured combinations yield a consistently antagonistic interaction in terms of the bacterial growth inhibition achieved, in contrast with the significant antagonistic protection AZM confers against damage induced by all of these drugs.

Acknowledgments
This image is the copyrighted work of the attributed author or publisher, and ZFIN has permission only to display this image to its users. Additional permissions should be obtained from the applicable author or publisher of the image. Full text @ Front Pharmacol