IMAGE

FIGURE 1

ID
ZDB-IMAGE-240322-9
Source
Figures for Bustad et al., 2024
Image
Figure Caption

FIGURE 1

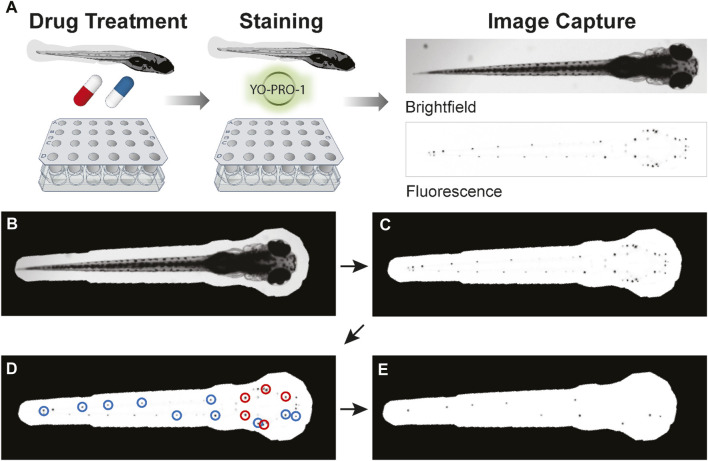
Overview of PEPITA workflow. (A) Zebrafish at 5dpf are placed into custom-made strainers in multi-well plates to be drug-treated and stained. After drug treatment for 4 h and YO-PRO-1 staining for 20 min, fish are anesthetized and imaged in brightfield and fluorescent channels. The resulting images are then quantified and analyzed. (B–E) An overview of PEPITA’s processing steps for quantifying whole-organism zebrafish image data. PEPITA accepts as input brightfield and fluorescence images of each organism. An additional fluorescence channel with no fluorophore present can also be optionally supplied, in which case PEPITA will use it as a baseline to cancel out autofluorescence in the image of fluorescently labeled neuromasts. (B) PEPITA creates a mask by automatically locating the larva by contrast, size, and shape from the brightfield image (which can be overridden manually when necessary). (C) This mask is applied to the fluorescence image in order to identify the points of interest. (D) PEPITA next identifies the 15 brightest local maxima within the masked region, excludes the top five (marked here in red), and creates a second mask obscuring everything except small circles (with a radius of 8 pixels by default) around the other ten puncta (marked here in blue). (E) This second mask is then reapplied to the fluorescence image, and the unobscured pixel values that exceed background level are summed to yield the raw fluorescence score for the given larva.

Acknowledgments
This image is the copyrighted work of the attributed author or publisher, and ZFIN has permission only to display this image to its users. Additional permissions should be obtained from the applicable author or publisher of the image. Full text @ Front Pharmacol