
- Title
-
Targeting TNF/IL-17/MAPK pathway in hE2A-PBX1 leukemia: effects of OUL35, KJ-Pyr-9, and CID44216842
- Authors
- Luo, H., Li, Q., Hong, J., Huang, Z., Deng, W., Wei, K., Lu, S., Wang, H., Zhang, W., Liu, W.
- Source
- Full text @ Haematologica
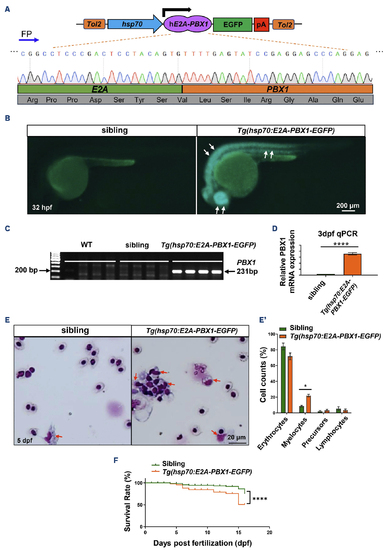
Generation and characterization of transgenic zebrafish expressing human E2A-PBX1 (hE2A-PBX1). (A) Schematic representation of Tg(hsp70:E2A-PBX1-EGFP) expression vector, and Sanger sequencing confirmed the presence of the hE2A-PBX1 sequence. FP: forward primer; pA: poly A termination sequence. (B) F4 generation hE2A-PBX1-transgenic embryos exhibited EGFP expression at 32 hours post-fertilization (hpf). EGFP- (sibling) and EGFP+ (Tg(hsp70:E2A-PBX1-EGFP)) embryos obtained by crossing the stable line Tg(hsp70:E2A-PBX1-EGFP) with wild-type (WT) fish. Tg(hsp70:E2A-PBX1-EGFP) embryos exhibited strong EGFP fluorescence (white arrows). (C) Specific polymerase chain reaction (PCR) amplification of a 231 bp fragment within the hE2A-PBX1 fusion region confirmed the integration of hE2A-PBX1 cDNA sequence into the genomes of Tg(hsp70:E2A-PBX1-EGFP). (D) Real time quantitative PCR (RT-qPCR) analysis showed hE2A-PBX1 mRNA high expression in Tg(hsp70:E2A-PBX1-EGFP) compared to the siblings at 3 days post-fertilization (dpf). The black asterisks indicate statistical difference (Student t tests, mean ± standard error of the mean; ****P<0.0001) (E) Wright-Giemsa staining of whole blood cells from siblings and Tg(hsp70:E2A-PBX1-EGFP) at 5 dpf. Myelocytes are indicated by red arrows in the image. (E’) Statistical analysis of the cell counts in panel (E). The black asterisks indicate statistical difference (one-way ANOVA, mean ± standard error of the mean; *P<0.05). N>150, number of zebrafish larvae. (F) Survival curves of Tg(hsp70:E2A-PBX1-EGFP) and sibling larvae up to 15 days after heat shock. The black asterisks indicate statistical difference (log-rank [Mantel-Cox] test; ****P<0.0001). |
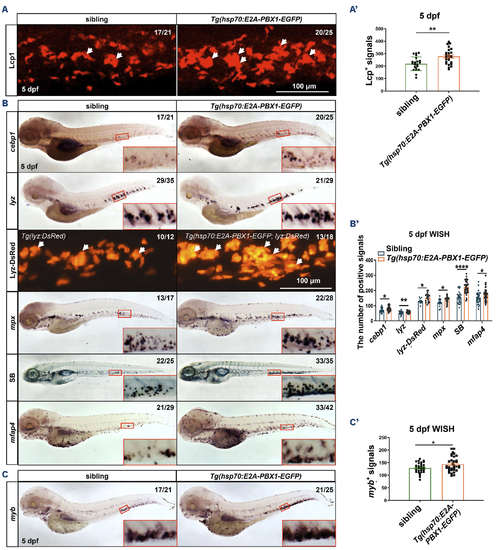
Induction of hE2A-PBX1 expression in zebrafish larvae leads to myeloid cell and hematopoietic stem cell expansion. (A) Immunofluorescence staining of Lcp1+ cells in siblings (left panel) and Tg(hsp70:E2A-PBX1-EGFP) (right panel) at 5 days post-fertilization (dpf). (A’) Statistical analysis of the Lcp1+ signals in panel (A). The black asterisks indicate statistical difference (Student t tests, mean ± standard error of the mean [SEM]; **P<0.01) (B) Whole mount in situ hybridization (WISH) of cebp1, lyz, mpx and mfap4 expressions in Tg(hsp70:E2A-PBX1-EGFP) (right panel) were higher than siblings (left panel) at 5 dpf. The number of lyzDsRed+ cells (caudal hematopoietic tissue [CHT] region and Sudan Black B-positive [SB+] cells in Tg(hsp70:E2A-PBX1-EGFP) (right) was higher than siblings (left) at 5 dpf. The CHT is enlarged in the red box (original magnification ×200). (B’) Statistical analysis of the positive signals (cebp1, lyz, lyz-DsRed, mpx, SB and mfap4) in panel (B). The black asterisks indicate statistical difference (Student t tests, mean ± SEM; *P<0.05, **P<0.01, ****P<0.0001) (C) WISH of myb expressions in Tg(hsp70:E2A-PBX1-EGFP) (right panel) were higher than siblings (left panel) at 5 dpf. (C’) Statistical analysis of the myb+ signals in panel (C). The black asterisks indicate statistical difference (Student t tests, mean ± SEM; *P<0.05). N/N: number of zebrafish larvae showing representative phenotype/total number of zebrafish larvae examined. |
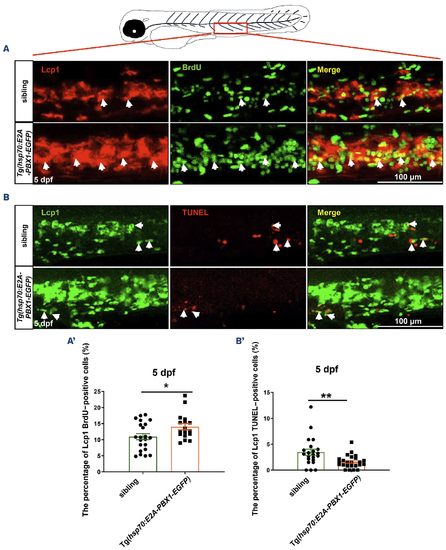
Abnormal myeloid cell expansion in Tg(hsp70:E2A-PBX1-EGFP) fish caused by proliferation and apoptosis perturbation. (A) Immunofluorescence double staining of Lcp1 and bromodeoxyuridine (BrdU) antibodies reveals a significant increase in myeloid cell proliferation in the caudal hematopoietic tissue (CHT) region of 5 days post-fertilization (dpf) Tg(hsp70:E2A-PBX1-EGFP) larvae (N=22) compared with the siblings (N=17). Lcp1/BrdU double-positive cells are indicated by white arrows. (A’) Statistical analysis of percentage of Lcp1+ BrdU+ cells in panel (A). The black asterisks indicate statistical difference (Student t tests, mean ± standard error of the mean; *P<0.05). (B) Co-staining of Lcp1 and transferase dUTP nick end labeling (TUNEL) was used to detect the apoptosis in the CHT region of 5 dpf Tg(hsp70:E2A-PBX1-EGFP) larvae (N=22) compared with the siblings (N=24). Lcp1/TUNEL double-positive cells are indicated by white arrows. (B’) Statistical analysis of percentage of Lcp1+ TUNEL+ cells in panel (B). The black asterisks indicate statistical difference (Student t tests, mean ± standard error of the mean; **P<0.01). |
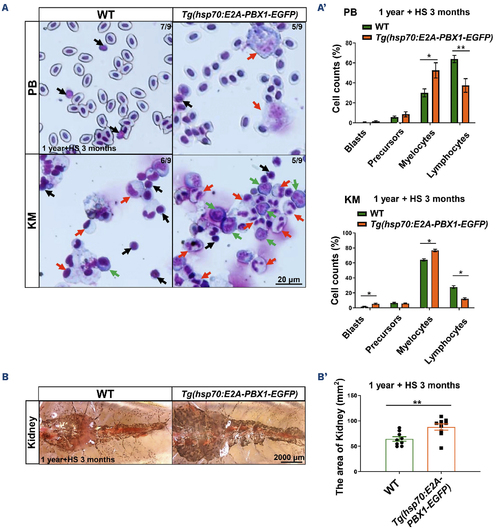
Tg(hsp70:E2A-PBX1-EGFP) adult fish exhibit abnormal myeloid cell expansion which resembles acute myeloid leukemia-like phenotypes. (A) May-Grunwald-Giemsa staining of peripheral blood (PB) cells (upper panels) and kidney marrow (KM) blood cells (lower panels) in 1-year-old wild-type (WT) (left panel) and Tg(hsp70:E2A-PBX1-EGFP) (right panel) adult fish after 3-month heat shock. Red arrows indicate myelocytes, black arrows indicate lymphocytes and green arrows indicate blasts. Original magnification ×400. Blood cell counts of PB and KM were calculated manually based on their morphology. (A’) Statistical analysis of cell counts in panel (A). The black asterisks indicate statistical difference (N=9, one-way ANOVA, mean ± standard error of the mean; *P<0.05, **P<0.01). (B) Kidneys from 1-year-old transgenic fish were enlarged to 1.36-fold in area compared with siblings after 3-month heat shock. (B’) Statistical analysis of the area of kidney in panel (B). The black asterisks indicate statistical difference (N=9, Student t tests, mean ± standard error of the mean; **P<0.01). |
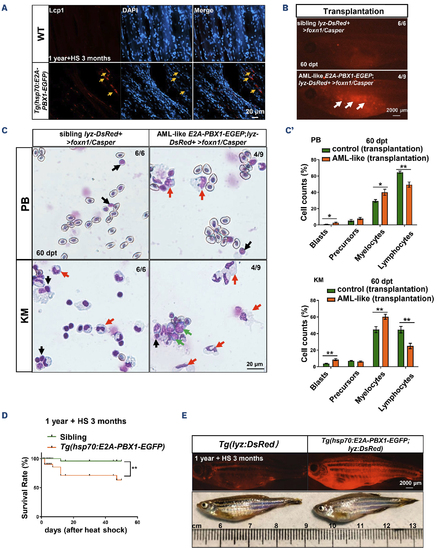
Tg(hsp70:E2A-PBX1-EGFP;lyz:DsRed) transgenic cells with induced acute myeloid leukemia-like disease are transplantable. (A) Immunofluorescent staining of the myeloid-specific marker Lcp1 in frozen sections confirmed myeloid cell invasion of the skeletal musculature in 1-year-old wild-type (WT) (left panel) and Tg(hsp70:E2A-PBX1-EGFP) (right panel) adult fish after 3-month heat shock (yellow arrows show invasion areas of myeloid cells into muscle tissue). (B) Direct observation of engrafted acute myeloid leukemia (AML)-like cells. At 60 days post-transplantation (dpt), AML-like E2A-PBX1 Lyz-DsRed+ cells could be visualized in foxn1/Casper-recipient kidney marrow (KM). The white arrow indicates the engrafted acute myeloid leukemia (AML)-like E2A-PBX1 Lyz-DsRed+ cells. N/N, number of zebrafish larvae showing representative phenotype/total number of zebrafish larvae examined. (C) Wright-Giemsa staining of blood cells in recipient KM after AML-like E2A-PBX1 and WT Lyz-DsRed+ transplantation. The red arrows indicate the AML-like myelocytes, the green arrows indicate the blasts and the black arrows indicate lymphocytes in recipients. (C’) Statistical analysis of cell counts in panel (C). The black asterisks indicate statistical difference (one-way ANOVA, mean ± standard error of the mean; *P<0.05, **P<0.01). (D) Survival curves of Tg(hsp70:E2APBX1-EGFP) and WT fish up to 90 day after heat shock. The black asterisks indicate statistical difference (log-rank [Mantel-Cox] test; **P<0.01). (E) Imaging of dying Tg(hsp70:E2A-PBX1-EGFP;lyz:DsRed) at 15-month-old after 3-month heat shock, reveals severe myeloid cell invasion. |
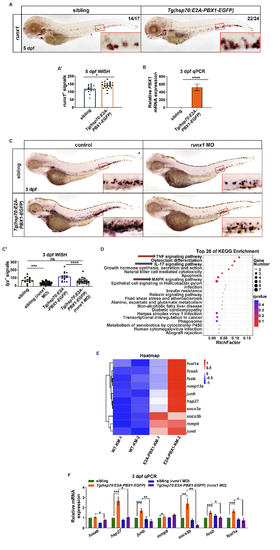
hE2A-PBX1 activate the TNF/IL-17/MAPK signaling pathway through upregulation of runx1 expression. (A) Whole mount in situ hybridization (WISH) of runx1 expressions in Tg(hsp70:E2A-PBX1-EGFP) (right panel) were higher than siblings (left panel) at 5 days post-fertilization (dpf). The caudal hematopoietic tissue (CHT) is enlarged in the red box (original magnification ×200). (A’) Statistical analysis of the runx1+ signals in panel (A). The black asterisks indicate statistical difference (Student t tests, mean ± standard error of the mean [SEM]; *P<0.05). N/N: number of zebrafish larvae showing representative phenotype/total number of zebrafish larvae examined. (B) Real time quantitative polymerase chain reaction (RT-qPCR) analysis showed increased runx1 mRNA expression in Tg(hsp70:E2A-PBX1-EGFP) compared to the sibling controls at 3 dpf. The black asterisks indicate statistical difference (Student t tests, mean ± SEM; ****P<0.0001) (C) Decreased number of lyz+ neutrophils in sibling and Tg(hsp70:E2APBX1-EGFP) larvae after injecting 0.2 mM runx1 morpholino (MO) at 3 dpf. The control groups were treated with 0.2 mM random sequence MO. The CHT is enlarged in the red box (original magnification ×200). (C’) Statistical analysis of the lyz+ signals shown in panel (C). The black asterisks indicate statistical difference (N≥15, one-way ANOVA, mean ± SEM; ***P<0.001, ****P<0.0001). (D) Top 20 enriched KEGG pathways identified in the analysis of differentially expressed genes (DEG) in KM cells from 6-month-old Tg(hsp70:E2A-PBX1-EGFP) compared to control groups after 3-month heat shock. The TNF/IL-17/MAPK signaling pathway is highlighted by the red arrow. (E) Heatmap of DEG involved in the TNF/IL-17/MAPK signaling pathway between WT and hE2A-PBX1 adult fish. Red and blue represent an increase and decrease gene expression levels, respectively; P<0.05. (F) RT-qPCR analysis showing mRNA expression of fosab, hsp27, junb, mmp9, socs3b, fosb and fosl1a in Tg(hsp70:E2A-PBX1-EGFP) compared to siblings after injecting 0.2 mM runx1 MO at 3 dpf. The control groups were treated with 0.2 mM random sequence MO (one-way ANOVA, mean ± SEM; *P<0.05, **P<0.01, ***P<0.001). TNF: tumor necrosis factor; IL-17: interleukin-17; MAPK: mitogen-activated protein kinase. |
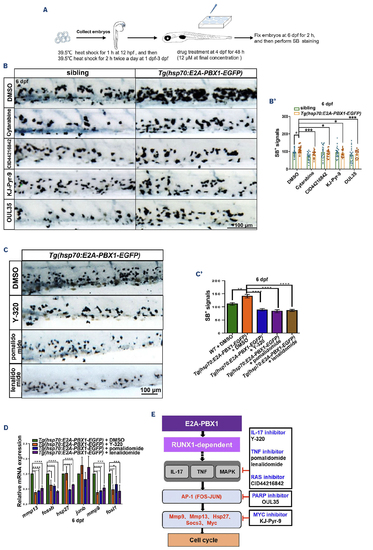
KJ-Pyr-9, OUL35, and CID44216842 effectively alleviate hE2A-PBX1-induced myeloid expansion in zebrafish larvae. (A) Flowchart illustrating the high-throughput drug screening process conducted in this study. Briefly, embryos were collected and subjected to a 1-hour heat shock at 12 hours post-fertilization (hpf), followed by twice daily 2-hour heat shocks from 1 to 3 days post-fertilization (dpf). Subsequently, zebrafish larvae were soaked in a solution containing small molecule compounds (initial screening concentration was 12 μM), the number of neutrophils was quantified using Sudan Black B (SB) staining at 6 dpf. (B) SB staining of sibling (left panel) and Tg(hsp70:E2A-PBX1-EGFP) (right panel) larvae after treatment with dimethyl sulfoxide (DMSO), 6.17 mM Ara-C (cytarabine), 8 μM KJ-Pyr-9, 20 μM CID44216842 and 24 μM of OUL35 at 6 dpf. (B’) Statistical analysis of the SB+ signals shown in panel (B). The black asterisks indicate statistical difference (N≥18, one-way ANOVA, mean ± standard error of the mean [SEM]; *P<0.05, ***P<0.001). (C) SB staining of hE2A-PBX1 zebrafish larvae after inhibitors treatment (DMSO, 500 µM pomalidomide, 500 μM lenalidomide, and 0.75 μM Y-320 inhibitor, respectively). The caudal hematopoietic tissue (CHT) is enlarged in the red box (original magnification ×200). (C’) Statistical analysis of the SB+ signals in panel (C). The black asterisks indicate statistical difference (N≥18, one-way ANOVA, mean ± SEM; **P<0.01, ****P<0.0001). (D) Real time quantitative polymerase chain reaction (RT-qPCR) analysis showing mRNA expression of mmp13, fosab, hsp27, junb, mmp9, and fosl1a in Tg(hsp70:E2A-PBX1-EGFP) compared to siblings after inhibitor treatment (one-way ANOVA, mean ± SEM; *P<0.05, ***P<0.001, ****P<0.0001). (E) Schematic representation of inhibitors targeting TNF/IL-17/MAPK signaling pathway. TNF: tumor necrosis factor; IL-17: interleukin-17; MAPK: mitogen-activated protein kinase. The AP-1 (activator protein 1) transcription factor is a dimeric complex that contains members of the JUN, FOS, ATF and MAF protein families. |
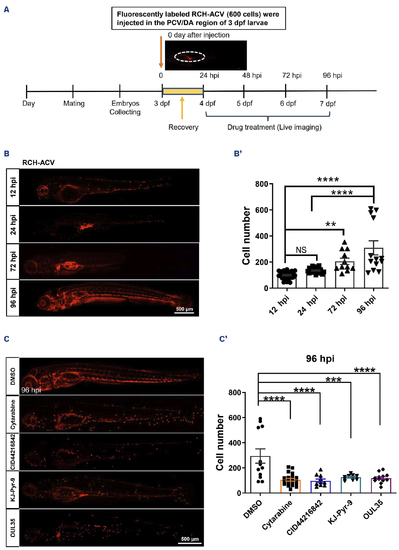
KJ-Pyr-9, OUL35 and CID44216842 effectively inhibit the oncogenicity of human E2A-PBX1-associated pre-B-lineage acute lymphoblastic leukemia. (A) Schematic representation of xenograft development using human B-lineage acute lymphoblastic leukemia (B-ALL) E2A-PBX1(+) RCH-ACV cells in zebrafish larvae. Briefly, embryos were injected with 600 fluorescently labeled RCH-ACV cells into the posterior cardinal vein (PCV) or dorsal aorta (DA) at 3 days post-fertilization (dpf), followed by treatment with small molecules at 24 hours post-injection (hpi). The pre-B ALL cells injected in runx1w84x embryos were monitored by imaging at 12 hpi, 24 hpi, 72 hpi and 96 hpi. (B) RCH-ACV cells were calculated after xenografting into runx1w84x zebrafish at 12 hpi, 24 hpi, 72 hpi and 96 hpi. (B’) Statistical analysis of the RCH-ACV cell number after injecting in panel (B). The black asterisks indicate statistical difference (N≥11, one-way ANOVA, mean ± standard error of the mean; **P<0.01, ****P<0.0001). (C) RCH-ACV cells were calculated after xenografting into runx1w84x zebrafish, followed by treatment with dimethyl sulfoxide (DMSO), 6.17 mM Ara-C (cytarabine), 8 μM KJ-Pyr-9, 20 μM CID44216842 and 24 μM OUL35 at 96 hpi. (C’) Statistical analysis of the RCH-ACV cell number with drug treatment after injecting in panel (C). The black asterisks indicate statistical difference (N≥10, one-way ANOVA, mean ± standard error of the mean; ***P<0.001, ****P<0.0001). |