
|
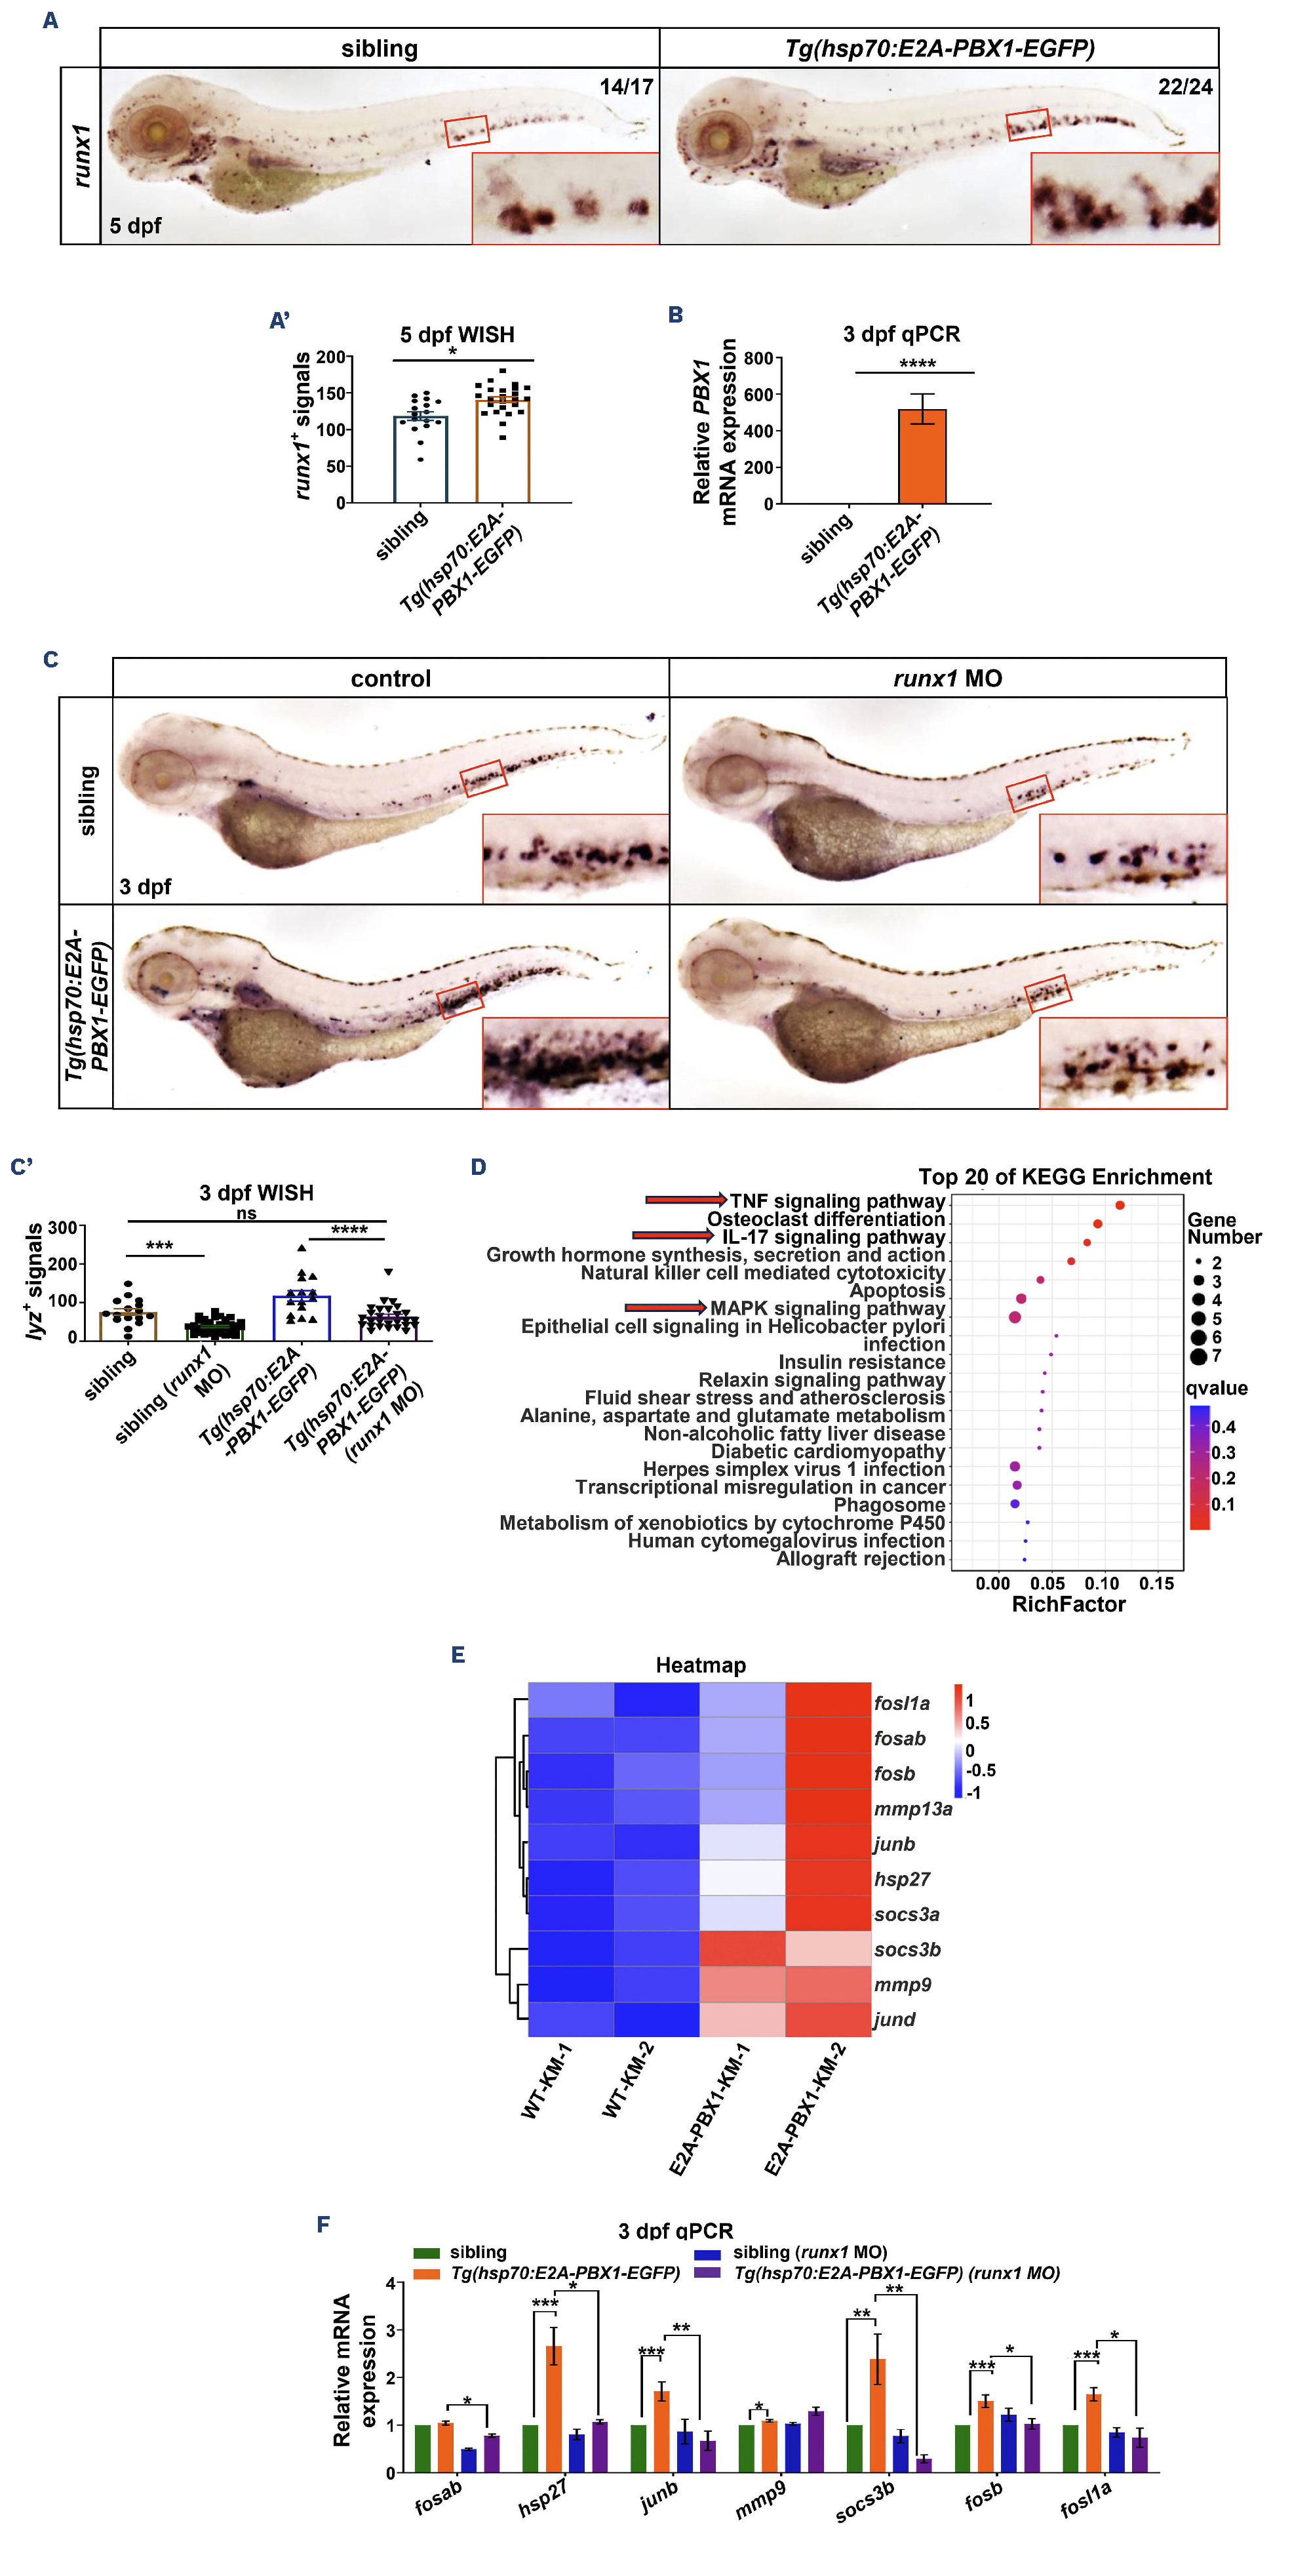
Fig. 6 hE2A-PBX1 activate the TNF/IL-17/MAPK signaling pathway through upregulation of runx1 expression. (A) Whole mount in situ hybridization (WISH) of runx1 expressions in Tg(hsp70:E2A-PBX1-EGFP) (right panel) were higher than siblings (left panel) at 5 days post-fertilization (dpf). The caudal hematopoietic tissue (CHT) is enlarged in the red box (original magnification ×200). (A’) Statistical analysis of the runx1+ signals in panel (A). The black asterisks indicate statistical difference (Student t tests, mean ± standard error of the mean [SEM]; *P<0.05). N/N: number of zebrafish larvae showing representative phenotype/total number of zebrafish larvae examined. (B) Real time quantitative polymerase chain reaction (RT-qPCR) analysis showed increased runx1 mRNA expression in Tg(hsp70:E2A-PBX1-EGFP) compared to the sibling controls at 3 dpf. The black asterisks indicate statistical difference (Student t tests, mean ± SEM; ****P<0.0001) (C) Decreased number of lyz+ neutrophils in sibling and Tg(hsp70:E2APBX1-EGFP) larvae after injecting 0.2 mM runx1 morpholino (MO) at 3 dpf. The control groups were treated with 0.2 mM random sequence MO. The CHT is enlarged in the red box (original magnification ×200). (C’) Statistical analysis of the lyz+ signals shown in panel (C). The black asterisks indicate statistical difference (N≥15, one-way ANOVA, mean ± SEM; ***P<0.001, ****P<0.0001). (D) Top 20 enriched KEGG pathways identified in the analysis of differentially expressed genes (DEG) in KM cells from 6-month-old Tg(hsp70:E2A-PBX1-EGFP) compared to control groups after 3-month heat shock. The TNF/IL-17/MAPK signaling pathway is highlighted by the red arrow. (E) Heatmap of DEG involved in the TNF/IL-17/MAPK signaling pathway between WT and hE2A-PBX1 adult fish. Red and blue represent an increase and decrease gene expression levels, respectively; P<0.05. (F) RT-qPCR analysis showing mRNA expression of fosab, hsp27, junb, mmp9, socs3b, fosb and fosl1a in Tg(hsp70:E2A-PBX1-EGFP) compared to siblings after injecting 0.2 mM runx1 MO at 3 dpf. The control groups were treated with 0.2 mM random sequence MO (one-way ANOVA, mean ± SEM; *P<0.05, **P<0.01, ***P<0.001). TNF: tumor necrosis factor; IL-17: interleukin-17; MAPK: mitogen-activated protein kinase.