
- Title
-
Caveolae disassemble upon membrane lesioning and foster cell survival
- Authors
- Štefl, M., Takamiya, M., Middel, V., Tekpınar, M., Nienhaus, K., Beil, T., Rastegar, S., Strähle, U., Nienhaus, G.U.
- Source
- Full text @ iScience
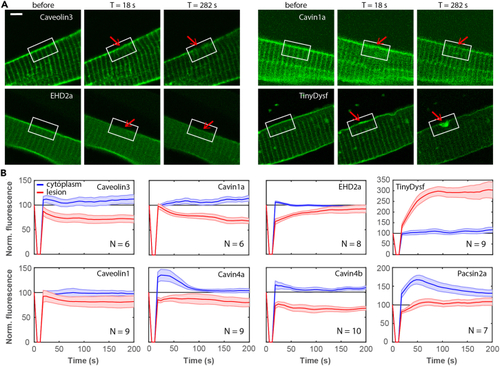
Caveolar proteins do not accumulate at the plasma membrane lesion site in zebrafish embryos (A) Caveolar proteins do not accumulate in the lesion patch. Fluorescence images of individual cells expressing Caveolin3-Clover, Clover-Cavin1a, EHD2a-Clover, and TinyDysf-Clover before and after laser-induced damage. The lesioning sites are marked by red arrows; white boxes surrounding the lesion sites mark regions with pronounced intensity changes. Scale bar (applies to all panels), 5 μm. (B) Caveolar proteins show distinct subcellular distributions after membrane lesioning. Time-dependent fluorescence of caveolar proteins fused to Clover at the lesion site (red) and in the cytoplasm (blue), respectively. Thick lines show averages over multiple cells (cell numbers, |
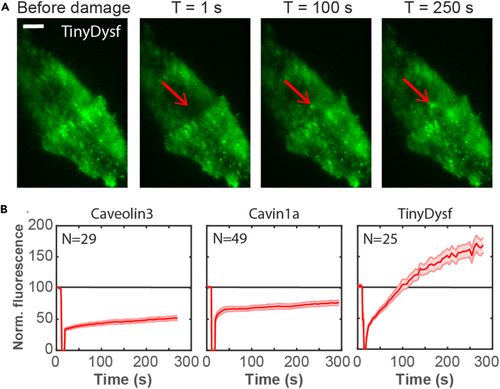
Caveolar proteins do not accumulate near a lesion inflicted in the C2C12 cell membrane (A) Representative images of the accumulation of TinyDysf-Clover at the site of a laser-induced lesion (marked by red arrow). Scale bar, 5 μm. (B) Time-dependent fluorescence of Caveolin3-mGarnet2, Cavin1a-mGarnet2, and TinyDysf-Clover at the lesion site. Thick lines show averages over multiple cells (cell numbers, |
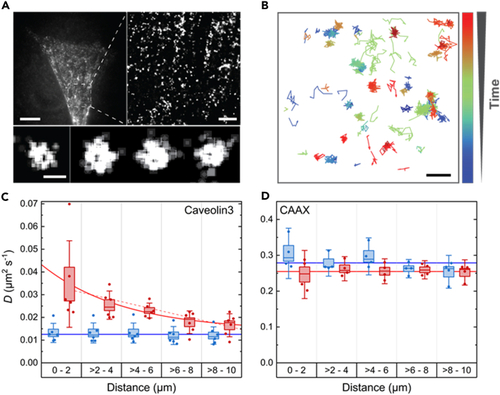
Diffusional dynamics of Caveolin3 and TinyDysf within C2C12 cell membranes before and after laser damage (A) Conventional epifluorescence image of a C2C12 cell transfected with Caveolin3-mEosFP (B) Example trajectories showing the movement of individual Caveolin3-mEosFP (C and D) Average diffusion coefficients, |
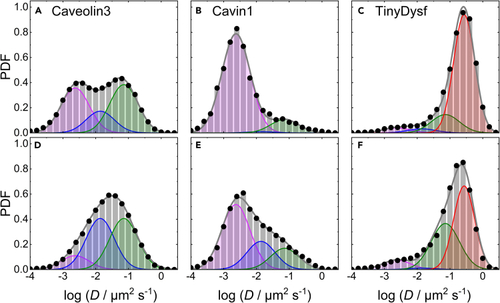
Area-normalized histograms (PDFs) of the number of mEosFP Top (A–C) and bottom (D–F) rows, data taken before and after lesioning, respectively. The data were obtained by MSD analysis of trajectories extracted from TIRF image sequences of C2C12 cells transiently expressing mEosFP |
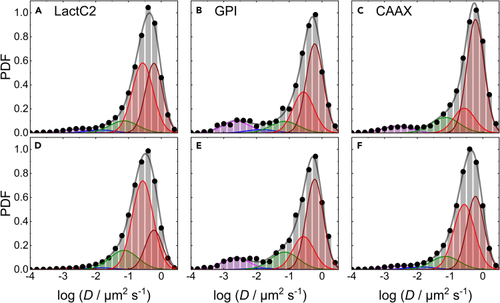
Area-normalized histograms (PDFs) of the number of mEosFP Top (A–C) and bottom (D–F) rows, data taken before and after lesioning, respectively. The data were obtained by MSD analysis of trajectories extracted from TIRF image sequences of C2C12 cells transiently expressing mEosFP |
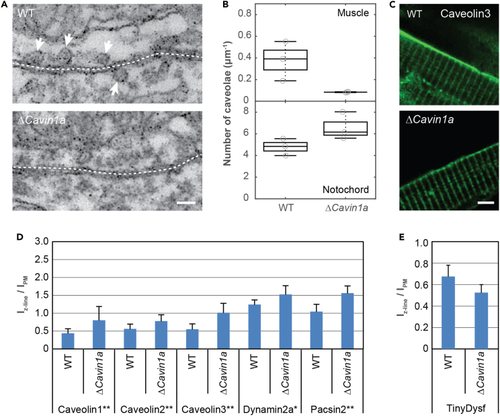
(A) EM images of slices of muscle tissue in wild-type (top) and Δ (B) Number of caveolae in muscle and notochord cells of wild-type and Δ (C) Representative fluorescence images of wild-type and Δ (D) Abundance of caveolar proteins tagged with Clover in the Z-lines, relative to the abundance in the sarcolemma. Error bars represent the SD. The significance was tested using the Bonferroni and Holm t test. (E) Abundance of TinyDysf-Clover in the Z-lines, relative to the abundance in the sarcolemma. |

Δ Temporal development of the relative emission intensities of different proteins at the lesion site in the wild-type (black) and (A) TinyDysf-Clover. (B) LactC2-EGFP. (C) BODIPY-Cholesterol. (D) Annexin2a-mOrange. (E) Annexin6-mOrange. (F) GCaMP5a-CAAX. Symbols show averages over multiple cells (cell numbers, |