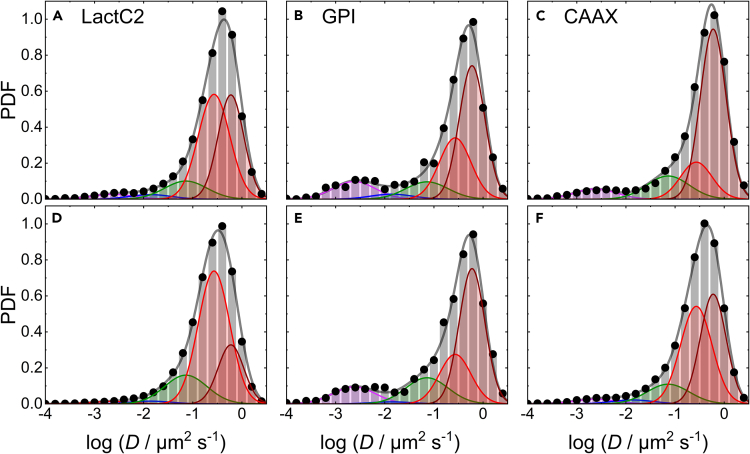
IMAGE

Figure 5

ID
ZDB-IMAGE-240202-5
Source
Figures for Štefl et al., 2024
Image
Figure Caption

Figure 5

Area-normalized histograms (PDFs) of the number of mEosFPthermo fusion protein trajectories versus the diffusion coefficient, D, (on a logarithmic scale)

Top (A–C) and bottom (D–F) rows, data taken before and after lesioning, respectively. The data were obtained by MSD analysis of trajectories extracted from TIRF image sequences of C2C12 cells transiently expressing mEosFPthermo-tagged (A, D) LactC2, (B, E) GPI anchor, and (C, F) CAAX motif. Symbols and bars, data; gray line, sum of log-Gaussians fitted to the histograms; individual log-Gaussian distributions are included in magenta, blue, green, red, and dark-red.

Acknowledgments
This image is the copyrighted work of the attributed author or publisher, and ZFIN has permission only to display this image to its users. Additional permissions should be obtained from the applicable author or publisher of the image. Full text @ iScience