FIGURE SUMMARY
Title

Variants in the WDR44 WD40-repeat domain cause a spectrum of ciliopathy by impairing ciliogenesis initiation

Authors
Accogli, A., Shakya, S., Yang, T., Insinna, C., Kim, S.Y., Bell, D., Butov, K.R., Severino, M., Niceta, M., Scala, M., Lee, H.S., Yoo, T., Stauffer, J., Zhao, H., Fiorillo, C., Pedemonte, M., Diana, M.C., Baldassari, S., Zakharova, V., Shcherbina, A., Rodina, Y., Fagerberg, C., Roos, L.S., Wierzba, J., Dobosz, A., Gerard, A., Potocki, L., Rosenfeld, J.A., Lalani, S.R., Scott, T.M., Scott, D., Azamian, M.S., Louie, R., Moore, H.W., Champaigne, N.L., Hollingsworth, G., Torella, A., Nigro, V., Ploski, R., Salpietro, V., Zara, F., Pizzi, S., Chillemi, G., Ognibene, M., Cooney, E., Do, J., Linnemann, A., Larsen, M.J., Specht, S., Walters, K.J., Choi, H.J., Choi, M., Tartaglia, M., Youkharibache, P., Chae, J.H., Capra, V., Park, S.G., Westlake, C.J.
Source
Full text @ Nat. Commun.

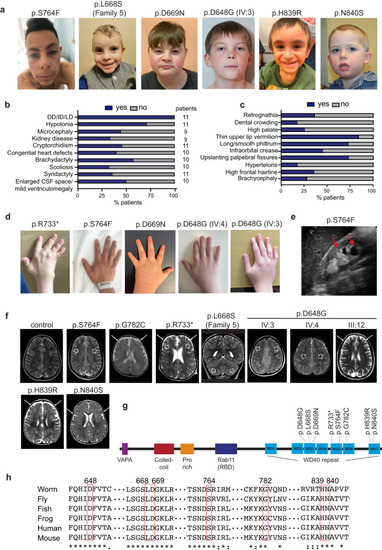
Clinical assessment of WDR44 variants.

a Photographs of subjects with WDR44 variants demonstrate common craniofacial features including high frontal hairline, upslanting palpebral fissure, smooth philtrum and thin upper lip vermilion in all patients with the exception of subject III:2 of family 9 harboring the c.2519A > G p.(N840S) who does not display major dysmorphism. Patients harboring the c.2291C > T p.(S764F) (Family 1) and c.1943A > G p.(D648G) (Family 4) variants also show long philtrum and mildly webbed neck. (b, c) Bar graph showing the distribution of the clinical and craniofacial features. Blue: presence of ciliopathy-related features. Gray: absence of ciliopathy-related features. Analysis for 11 patients (c). d Photos of hands showing digital abnormalities including brachydactyly in all showed patients, and camptodactyly of fifth fingers for patient with c.1943A > G p.(D648G) (family 4) and ulnar deviation in the patient harboring the c.2197C > T p.(R733*) variant (family 3). e Kidney ultrasound of patient with c.2291C > T p.(S764F) variant shows parapelvic cysts (red arrows). f Neuroimaging features of the affected subjects with normal control for comparison. Brain MRI with axial T2-weighted images showing mild simplified gyral pattern and faint T2-weighted hyperintensity of the deep fronto-parietal white matter (white empty arrows) in subject III:1 of Family 1 and IV:4 and IV:3 of Family 4. Brain MRI with axial T2 weighted images showing mild enlargement of the subarachnoid spaces (thin arrows) with white matter volume reduction and ventricular enlargement in subjects II:1 of Family 2, III:12 of Family 4, III:2 of Family 8, and III:2 of Family 9. g The schematic represents the WDR44 protein and its domains. The position of variants is indicated in the WDR domain. h Multiple sequence alignment analysis of WDR44 wild-type protein across species. The numbers represent the position of conserved amino acid residues that are altered in the patients. Source data are provided as a Source Data file. DD/ID/LD developmental delay/intellectual disability/learning disability, CSF cerebrospinal fluid.

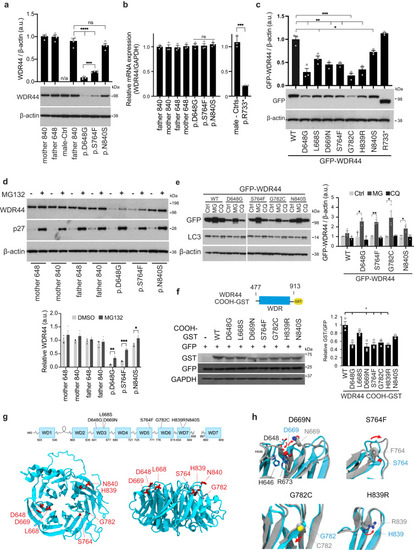
WDR44 variants affect protein stability and reduce expression.

a Immunoblotting analysis of WDR44 and β-actin in lysates from control (matched and unmatched parents) and WDR44 variant patient fibroblast cells. Proteins band relative intensity is indicated by the graph (above). Statistical comparisions with father 840 or p.D648G are shown. P ≤ 0.0001 (p.D648G, p.S764F), 0.0002 (p.S764F). b WDR44 mRNA relative expression was determined by real-time RT-PCR in control and WDR44 variant patient fibroblasts from 3 independent mRNA isolations. c Immunoblotting analysis of transiently expressed GFP-WDR44 wild-type and variants in 293T cells post 48 h of transfection. Proteins band relative intensity is indicated by the graph (above). Statistical comparisons with wild-type (WT) are shown. P = 0.0108 (L668S), 0.0233 (N840S), 0.0026 (D648G), 0.0027 (D669N), 0.002 (S764F), 0.002 (H839R), 0.0008 (G782C). d Immunoblotting analysis of proteins from the lysates of 24 h vehicle control (-) or 1μM MG132 (+) treated fibroblast cells. p27 is used as a positive marker of proteasome inhibition. Proteins band relative intensity is indicated by the graph (below). Statistical comparisons between DMSO vehicle control and MG132 are shown. P = 0.0365 (p.N840S), 0.0014 (p.D648G), 0.0004 (p.S764F). e Immunoblotting analysis of transiently expressed GFP-WDR44 wild-type or variants in 293T cells treated with vehicle control (Ctrl) or 1μM MG132 (MG) for 16 h or 10μM Chloroquine (CQ) for 24 h. Protein band relative intensity is indicated by the graph (right). Statistical comparisons between Ctrl and MG are shown. P = 0.0355 (D648G), 0.0422 (G782C), 0.029 (N840S), 0.0018 (S764F). f Immunoblotting analysis of COOH-terminal domain of wild-type or variants in 293T cells 48 h after transfection. GFP was used as an internal control of transfection. Schematic above represents the COOH-terminal region of WDR44 used for the analysis. Proteins band relative intensity is indicated by the graph (right). P = 0.0144 (D648G), 0.0105 (D669N), 0.0132 (S764F), 0.0207 (G782C), 0.0230 (H839R). g Predicted structure of the WDR44 WDR domain for residues 480–858 and 887–913 modeled from the AF predicted structure (AF-Q5JSH3). Residues mutated in patients are shown in red. h Structure alignment of WDR44 WDR wild-type (cyan) and patient missense variant (grey). The patient variant structures were built from the structure described in (g) followed by 500 ns MD simulation to assess conformational changes. Patient variants shown to have the largest conformational changes based on RMSD/residue analysis in Fig. S3d. Red arrows show change in position of patient variants from wild-type. Mean ± s.e.m. from three (bf) or four (a) independent experiments. Unpaired two-tailed t-test; *P < 0.05, **P < 0.01, ***P < 0.001, ****P < 0.0001, non-significant (ns). Source data are provided as a Source Data file.

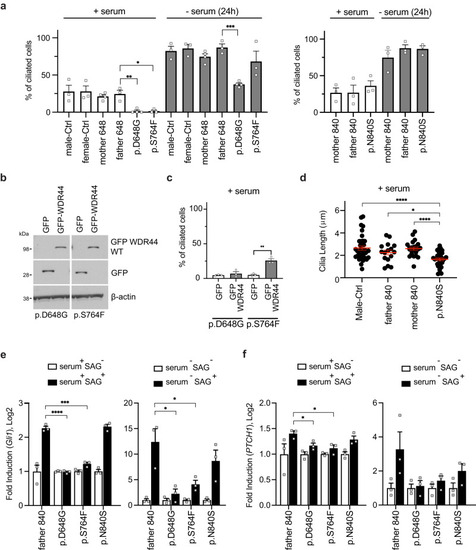
Patient fibroblasts have affected ciliation and Hedgehog signaling.

a Quantification of ciliation in control and WDR44 variant (p.D648G, p.S764F, p.N840S) patient fibroblast fed with 10% serum (+serum) or starved (−serum) for 24 h, followed by anti-Arl13b, anti-CEP164, and anti-CP110 antibodies staining. >150 cells were counted from three or more independent experiments. Statistical comparisons with father 648 are shown. +serum: P = 0.012 (p.S764F), 0.0039 (p.D648G), −serum (24 h): P = 0.0001 (p.D648G). b Immunoblotting analysis of GFP or GFP-WDR44 wild-type and β-actin from lysates of patient fibroblasts. Probed for GFP and β-actin antibodies. c Ciliation was quantified in p.D648G and p.S764F patient fibroblast rescued with GFP control or GFP-WDR44 wild-type. >150 cells were counted from three independent experiments. P = 0.0024 (p.S764F). d Quantification of cilia length in fibroblast from p.N840S and controls that were stained as in (a). Statistical comparisons with p.N840S. P = 0.0131 (father 840), <0.0001 (Male-Ctrl, mother 840). (e, f) Hedgehog signaling was analyzed in parental control and patient fibroblasts. GLI1 (e) and PTCH1 (f) transcript fold induction determined by real-time RT-PCR in fibroblast fed with 10% serum (serum+) or starved (serum-) in the presence (SAG+) or absence (SAG-) of SAG for 24 h. Statistical comparisons with father 840 SAG+ are shown. e serum+: P = 0.0001 (p.S764F), <0.0001 (p.D648G), serum-: P = 0.0211 (p.D648G), 0.0375 (p.S764F). f serum+: P = 0.03 (p.D648G), 0.025 (p.S764F). Mean ± s.e.m. from three independent experiments. Unpaired two-tailed t-test; *P < 0.05, **P < 0.01, ***P < 0.001, ****P < 0.0001. Source data are provided as a Source Data file.

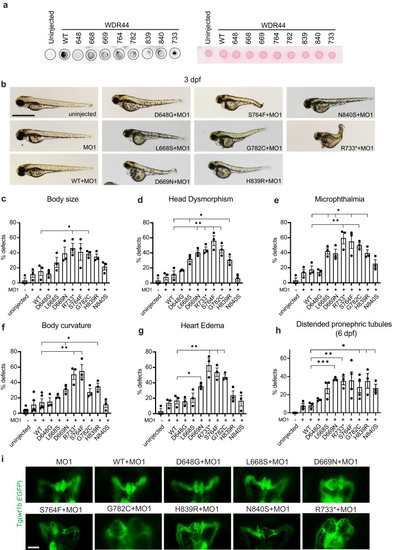
WDR44 variants affect zebrafish embryonic development.

a Dot blot analysis of WDR44 wild-type and variants expressed in zebrafish morphants (left). Protein loading was demonstrated by Ponceau staining of dot blot (right) probed with WDR44 antibodies. b Bright-field (BF) image analysis of zebrafish embryos injected with wdr44 morpholino and rescued with mRNA of human WDR44 wild-type or variants. Scale bar, 1 mm. (ch) Quantification of developmental defects: body size, head dysmorphism, microphthalmia, body curvature, heart edema at 3 dpf, and distended pronephric tubules at 6 dpf. Statistical comparison with WT are shown. cP = 0.0229 (R733*), 0.0236 (G782C). dP = 0.0261 (L668S), 0.0062 (D669N), 0.0049 (R733*), 0.0052 (S764F), 0.0079 (G782C), 0.0355 (H839R). eP = 0.0157 (L668S), 0.0404 (D669N), 0.0099 (R733*), 0.0251 (S764F), 0.0046 (G782C), 0.0260 (H839R). fP = 0.0379 (D669N), 0.0032 (R733*), 0.0028 (S764F), 0.0204 (H839R). g 0.0204 (D669N), 0.0080 (R733*), 0.0067 (S764F), 0.0044 (G782C). hP = 0.0003 (D669N), 0.0053 (R733*), 0.0480 (G782C), 0.0331 (H839R), 0.0163 (N840S). i Representative images of 3 dpf Tg(wt1b:EGFP) embryos injected as in (b) showing developing pronephros. Scale bar, 50 μm. Mean ± s.e.m. from three independent experiments imaging >60 embryos (ch) or >10 embryos (i). Unpaired two-tailed t-test; *P < 0.05, **P < 0.01, ***P < 0.001. Source data are provided as a Source Data file.

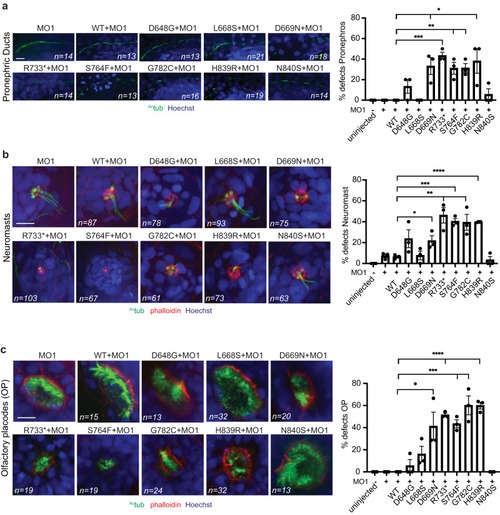
WDR44 variants reduce ciliogenesis in zebrafish embryos.

Quantification (right) of ciliation in pronephric ducts (a), neuromasts (b), and olfactory placode (c) in zebrafish embryos at 3 dpf. Embryos were injected with wdr44 morpholino with or without mRNA of human WDR44 wild-type and variants, followed by staining with anti-acetylated tubulin antibody and Hoechst. Phalloidin staining was performed in (b, c). Represented  immunofluorescence microscopy (IFM) (left) images. Scale bars, 10 μm. Statistical comparison with wdr44MO + WT are shown. aP = 0.0161 (D669N), 0.0002 (R733*), 0.0061 (S764F), 0.0023 (G782C), 0.0328 (H839R). bP = 0.1155 (D648G), 0.0360 (D669N), 0.0064 (R733*), 0.0003 (S764F), 0.0129 (G782C), <0.0001 (H839R). cP = 0.0309 (D669N), <0.0001 (R733*), 0.0003 (S764F), 0.0021 (G782C), P < 0.0001 (H839R). Mean ± s.e.m. from three independent experiments and total number of embryos imaged are indicated on images. Unpaired two-tailed t-test; *P < 0.05, **P < 0.01, ***P < 0.001, ****P < 0.0001. Source data are provided as a Source Data file.

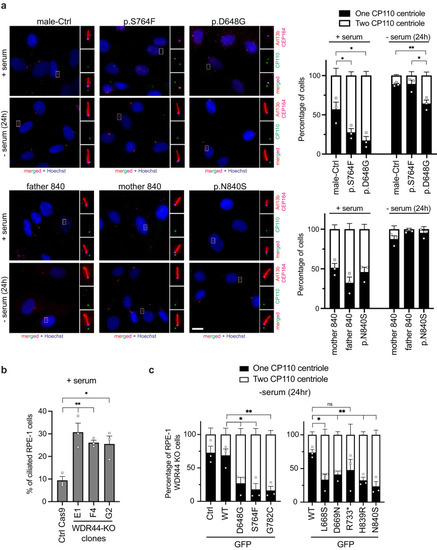
WDR44 variants reduce ciliogenesis initiation.

a Quantification (right) of MC uncapping (denoted as one CP110 centriole on daughter centriole) and capped MC (denoted as two CP110 centriole on both mother and daughter centriole) in the patient and control fibroblast fed with 10% serum (+serum) or starved (−serum) for 24 h. Cells were stained with anti-Arl13b, anti-CEP164, and anti-CP110 antibodies. Nuclei were stained with Hoechst 33342. Represented IFM images (left). Scale bars, 10 μm. >100 cells were counted from three independent experiments. Statistical comparisions with male-Ctrl or p.S764F are shown. +serum: P = 0.0499 (p.S764F), 0.0211 (D648G), −serum (24 h): P = 0.0211 (p.D648G), P = 0.0065 (pD648G). b Percentage of ciliation determined by immunostaining RPE-1 control Cas9 and WDR44 KO clones with anti-Arl13b and anti-CEP164. >150 cells were counted from three independent experiments. Statistical comparisons with Ctrl Cas9 are shown. P = 0.0148 (G2), 0.0081 (E1), 0.0011 (F4). c Quantification of MC uncapping as in (a) in the RPE1 WDR44 KO F4 cells transiently expressing GFP control or GFP-WDR44 wild-type or variants for 48 h. >60 cells with similar GFP expression were counted from three independent experiments. Statistical comparisons with GFP-WDR44 wild-type (WT) are shown. P = 0.0329 (D648G), 0.0178 (S764F), 0.0131 (L668S), 0.01 (G782C), 0.0084 (D669N), 0.0032 (H839R), 0.0039 (N840S). Mean ± s.e.m.. Unpaired two-tailed t-test; *P < 0.05, **P < 0.01, non-significant (ns). Source data are provided as a Source Data file.

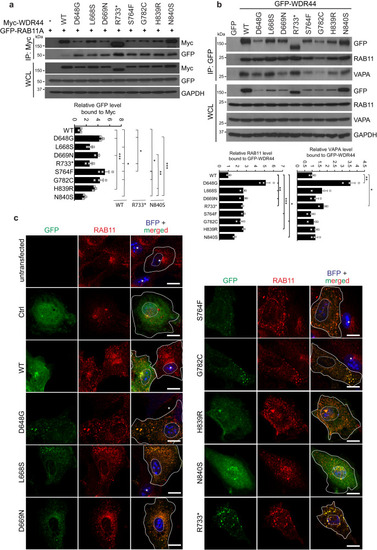
WDR44 patient variants enhance binding to RAB11 and cause RAB11 redistribution in cells.

a Coimmunoprecipitation analysis of coexpressed GFP-RAB11A and Myc-WDR44 wild-type or variant in 293T for 48 h. Myc-tagged proteins were immunoprecipitated from 293T lysate and probed with GFP, Myc, and GAPDH. The plot (below) shows the relative co-immunoprecipitated levels of GFP-RAB11A bound to Myc-WDR44 wild-type or variants from three independent experiments. Statistical analysis comparing wild-type (WT), R733* and N840S are shown vs WT: P = 0.0269 (L668S), 0.0459 (R733*), 0.0236 (S764F), 0.0226 (G782C), 0.0261 (N840S), 0.0002 (D648G), 0.0009 (D669N), 0.0002 (H839R); vs R733*: P = 0.0459 (WT), 0.0221 (D648G), 0.0448 (S764F); vs N840S: P = 0.0261 (WT), 0.0333 (S764F), 0.0356 (G782C), 0.0018 (D669N), 0.0011 (H839R), 0.0004 (D648G). b Immunoprecipitation analysis of GFP-WDR44 wild-type or variants transiently expressed in RPE1 WDR44 KO F4 cells for 48 h. GFP proteins were immunoprecipitated from lysate and probed with GFP, RAB11, VAPA, and GAPDH antibodies. Blots are represented from three independent experiments. The plots (below) shows the relative co-immunoprecipitated levels of RAB11 and VAPA bound to GFP-WDR44 wild-type or variants. RAB11: P = 0.0183 (G782C), 0.0135 (N840S), 0.0086 (D648G), 0.0022 (L668S), 0.0065 (D669N), 0.0023 (R733*), 0.0005 (S764F), 0.0009 (H839R); VAPA: P = 0.0229 (R733*), P = 0.0087 (D648G). c IFM images of RPE1 WDR44 KO F4 cells transfected with GFP or GFP-WDR44 wild-type or variants. Cells express BFP and are immunostained with RAB11. Plasma membrane and nuclei are indicated by solid and dotted lines, respectively. Representative images from 20–25 cells are shown. White asterisk denotes untransfected cells. Scale bars, 10 μm. Mean ± s.e.m. from three independent experiments. Unpaired two-tailed t-test; *P < 0.05, **P < 0.01, ***P < 0.001. Source data are provided as a Source Data file. WCL whole cell lysate.

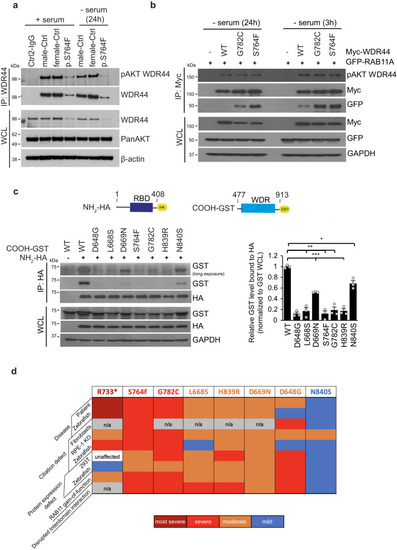
Interactions between NH2-terminus containing the RBD and the WDR are affected by patient variants.

a Immunoprecipitation of endogenous WDR44 from controls and p.S764F patient fibroblast in the presence of 10% serum (+serum) or starved (−serum) for 24 h. Immunoblots were probed with WDR44, pAkt-substrate (pAKT WDR44), PanAKT, and β-actin antibodies. Blots are represented from two independent experiments. b Immunoblot analysis of Akt phosphorylation of Myc-WDR44 wild-type or G782C or S764F, and GFP-RAB11 co-immunoprecipitated under ciliating conditions (3 h and 24 h serum starvation) from 293T cells expressing indicated plasmids for 48 h. GAPDH was used to evaluate starting lysate protein levels. Blots are represented from two independent experiments. c The schematic represents (top) WDR44 domains, HA-NH2-terminal domain containing RBD (1-408AA), and GST-COOH-terminal domain containing WDR (477-913 AA). Immunoblotting analysis (bottom left) showing co-immunoprecipitation between HA-NH2-terminal domain and GST-COOH-terminal domain of wild-type or variants from 293T cells expressing indicated plasmids for 48 h. Plot (right) shows the relative co-immunoprecipitated levels of GST-COOH-terminal WDR44 compared to HA-NH2-terminal WDR44 proteins normalized to pre-IP levels of GST-COOH-terminal. P = 0.0224 (N840S), 0.0035 (L668S), 0.0021 (S764F), 0.0031 (G782C), 0.0001 (D648G), 0.0004 (D669N), 0.0008 (H839R). Mean ± s.e.m. from three independent experiments. Unpaired two-tailed t-test; *P < 0.05, **P < 0.01, ***P < 0.001. d Summary of WDR44 variant results. Source data are provided as a Source Data file.

ZFIN is incorporating published figure images and captions as part of an ongoing project. Figures from some publications have not yet been curated, or are not available for display because of copyright restrictions.

Acknowledgments
This image is the copyrighted work of the attributed author or publisher, and ZFIN has permission only to display this image to its users. Additional permissions should be obtained from the applicable author or publisher of the image. Full text @ Nat. Commun.