IMAGE

Fig. 2

ID
ZDB-IMAGE-240110-23
Source
Figures for Accogli et al., 2024
Image
Figure Caption

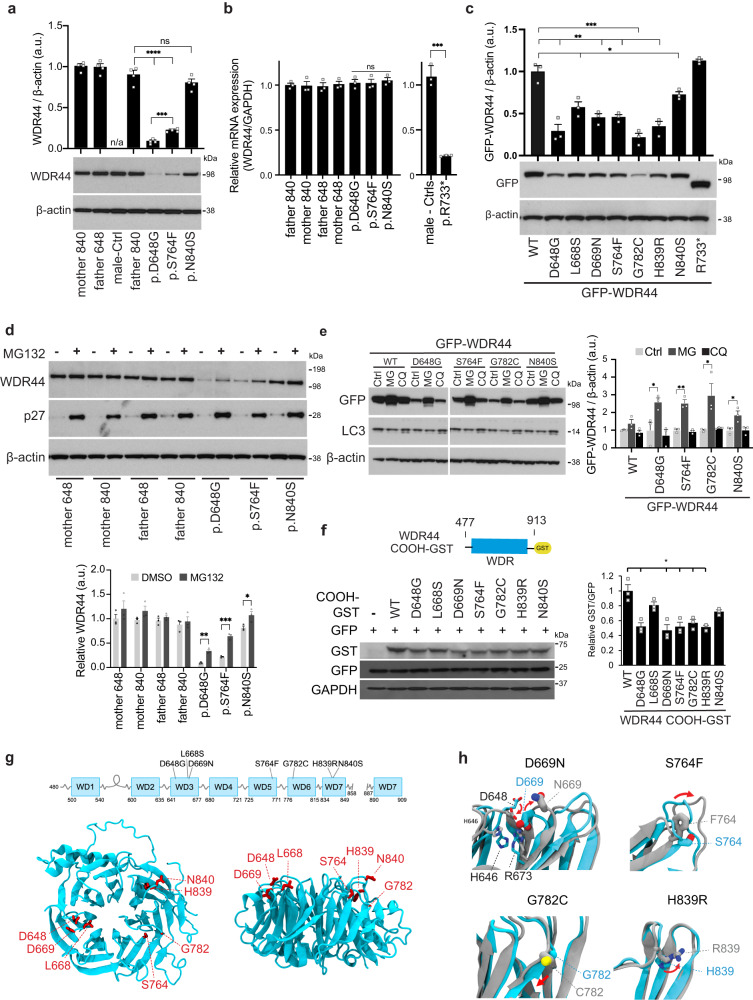
Fig. 2 WDR44 variants affect protein stability and reduce expression.

a Immunoblotting analysis of WDR44 and β-actin in lysates from control (matched and unmatched parents) and WDR44 variant patient fibroblast cells. Proteins band relative intensity is indicated by the graph (above). Statistical comparisions with father 840 or p.D648G are shown. P ≤ 0.0001 (p.D648G, p.S764F), 0.0002 (p.S764F). b WDR44 mRNA relative expression was determined by real-time RT-PCR in control and WDR44 variant patient fibroblasts from 3 independent mRNA isolations. c Immunoblotting analysis of transiently expressed GFP-WDR44 wild-type and variants in 293T cells post 48 h of transfection. Proteins band relative intensity is indicated by the graph (above). Statistical comparisons with wild-type (WT) are shown. P = 0.0108 (L668S), 0.0233 (N840S), 0.0026 (D648G), 0.0027 (D669N), 0.002 (S764F), 0.002 (H839R), 0.0008 (G782C). d Immunoblotting analysis of proteins from the lysates of 24 h vehicle control (-) or 1μM MG132 (+) treated fibroblast cells. p27 is used as a positive marker of proteasome inhibition. Proteins band relative intensity is indicated by the graph (below). Statistical comparisons between DMSO vehicle control and MG132 are shown. P = 0.0365 (p.N840S), 0.0014 (p.D648G), 0.0004 (p.S764F). e Immunoblotting analysis of transiently expressed GFP-WDR44 wild-type or variants in 293T cells treated with vehicle control (Ctrl) or 1μM MG132 (MG) for 16 h or 10μM Chloroquine (CQ) for 24 h. Protein band relative intensity is indicated by the graph (right). Statistical comparisons between Ctrl and MG are shown. P = 0.0355 (D648G), 0.0422 (G782C), 0.029 (N840S), 0.0018 (S764F). f Immunoblotting analysis of COOH-terminal domain of wild-type or variants in 293T cells 48 h after transfection. GFP was used as an internal control of transfection. Schematic above represents the COOH-terminal region of WDR44 used for the analysis. Proteins band relative intensity is indicated by the graph (right). P = 0.0144 (D648G), 0.0105 (D669N), 0.0132 (S764F), 0.0207 (G782C), 0.0230 (H839R). g Predicted structure of the WDR44 WDR domain for residues 480–858 and 887–913 modeled from the AF predicted structure (AF-Q5JSH3). Residues mutated in patients are shown in red. h Structure alignment of WDR44 WDR wild-type (cyan) and patient missense variant (grey). The patient variant structures were built from the structure described in (g) followed by 500 ns MD simulation to assess conformational changes. Patient variants shown to have the largest conformational changes based on RMSD/residue analysis in Fig. S3d. Red arrows show change in position of patient variants from wild-type. Mean ± s.e.m. from three (bf) or four (a) independent experiments. Unpaired two-tailed t-test; *P < 0.05, **P < 0.01, ***P < 0.001, ****P < 0.0001, non-significant (ns). Source data are provided as a Source Data file.

Acknowledgments
This image is the copyrighted work of the attributed author or publisher, and ZFIN has permission only to display this image to its users. Additional permissions should be obtained from the applicable author or publisher of the image. Full text @ Nat. Commun.