IMAGE

Fig. 6

ID
ZDB-IMAGE-240110-28
Source
Figures for Accogli et al., 2024
Image
Figure Caption

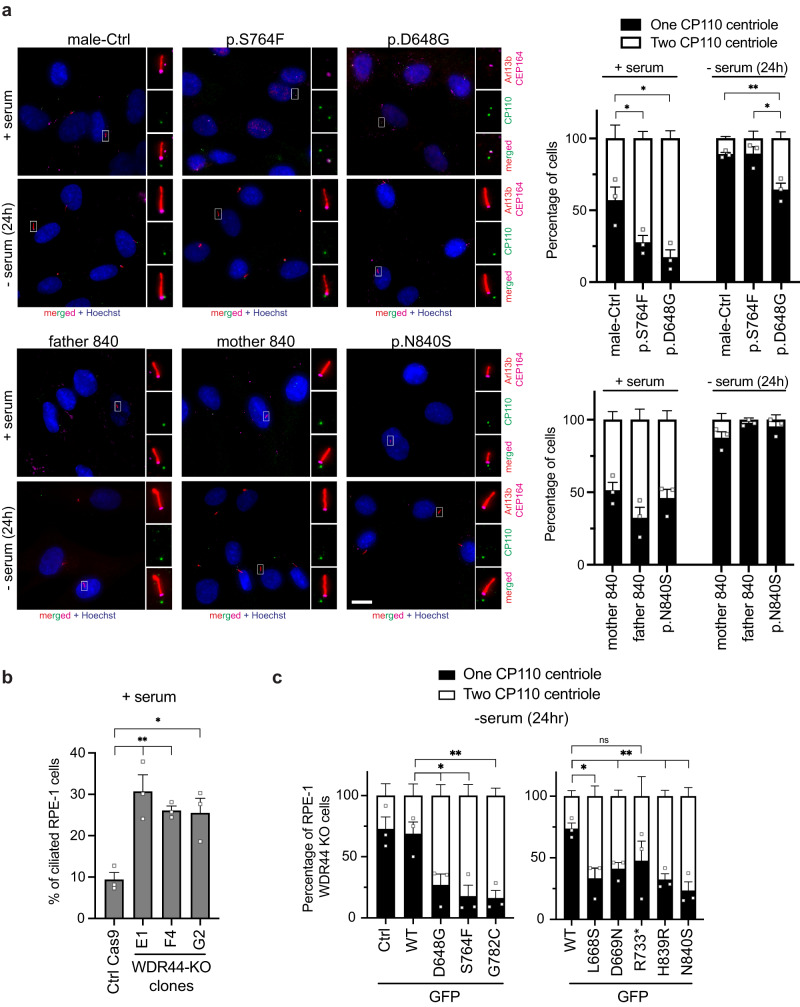
Fig. 6 WDR44 variants reduce ciliogenesis initiation.

a Quantification (right) of MC uncapping (denoted as one CP110 centriole on daughter centriole) and capped MC (denoted as two CP110 centriole on both mother and daughter centriole) in the patient and control fibroblast fed with 10% serum (+serum) or starved (−serum) for 24 h. Cells were stained with anti-Arl13b, anti-CEP164, and anti-CP110 antibodies. Nuclei were stained with Hoechst 33342. Represented IFM images (left). Scale bars, 10 μm. >100 cells were counted from three independent experiments. Statistical comparisions with male-Ctrl or p.S764F are shown. +serum: P = 0.0499 (p.S764F), 0.0211 (D648G), −serum (24 h): P = 0.0211 (p.D648G), P = 0.0065 (pD648G). b Percentage of ciliation determined by immunostaining RPE-1 control Cas9 and WDR44 KO clones with anti-Arl13b and anti-CEP164. >150 cells were counted from three independent experiments. Statistical comparisons with Ctrl Cas9 are shown. P = 0.0148 (G2), 0.0081 (E1), 0.0011 (F4). c Quantification of MC uncapping as in (a) in the RPE1 WDR44 KO F4 cells transiently expressing GFP control or GFP-WDR44 wild-type or variants for 48 h. >60 cells with similar GFP expression were counted from three independent experiments. Statistical comparisons with GFP-WDR44 wild-type (WT) are shown. P = 0.0329 (D648G), 0.0178 (S764F), 0.0131 (L668S), 0.01 (G782C), 0.0084 (D669N), 0.0032 (H839R), 0.0039 (N840S). Mean ± s.e.m.. Unpaired two-tailed t-test; *P < 0.05, **P < 0.01, non-significant (ns). Source data are provided as a Source Data file.

Acknowledgments
This image is the copyrighted work of the attributed author or publisher, and ZFIN has permission only to display this image to its users. Additional permissions should be obtained from the applicable author or publisher of the image. Full text @ Nat. Commun.