FIGURE SUMMARY
Title

Bi-allelic ACBD6 variants lead to a neurodevelopmental syndrome with progressive and complex movement disorders

Authors
Kaiyrzhanov, R., Rad, A., Lin, S.J., Bertoli-Avella, A., Kallemeijn, W.W., Godwin, A., Zaki, M.S., Huang, K., Lau, T., Petree, C., Efthymiou, S., Ghayoor Karimiani, E., Hempel, M., Normand, E.A., Rudnik-Schöneborn, S., Schatz, U.A., Baggelaar, M.P., Ilyas, M., Sultan, T., Alvi, J.R., Ganieva, M., Fowler, B., Aanicai, R., Akay Tayfun, G., Al Saman, A., Alswaid, A., Amiri, N., Asilova, N., Shotelersuk, V., Yeetong, P., Azam, M., Babaei, M., Bahrami Monajemi, G., Mohammadi, P., Samie, S., Banu, S.H., Basto, J.P., Kortüm, F., Bauer, M., Bauer, P., Beetz, C., Garshasbi, M., Hameed Issa, A., Eyaid, W., Ahmed, H., Hashemi, N., Hassanpour, K., Herman, I., Ibrohimov, S., Abdul-Majeed, B.A., Imdad, M., Isrofilov, M., Kaiyal, Q., Khan, S., Kirmse, B., Koster, J., Lourenço, C.M., Mitani, T., Moldovan, O., Murphy, D., Najafi, M., Pehlivan, D., Rocha, M.E., Salpietro, V., Schmidts, M., Shalata, A., Mahroum, M., Talbeya, J.K., Taylor, R.W., Vazquez, D., Vetro, A., Waterham, H.R., Zaman, M., Schrader, T.A., Chung, W.K., Guerrini, R., Lupski, J.R., Gleeson, J., Suri, M., Jamshidi, Y., Bhatia, K.P., Vona, B., Schrader, M., Severino, M., Guille, M., Tate, E.W., Varshney, G.K., Houlden, H., Maroofian, R.
Source
Full text @ Brain

Family pedigrees, schematic variants’ representation, conserved regions of substitution variants in ACBD6, and splicing effects. (A) Pedigrees and segregation results for the 28 unrelated families. Double lines between individuals represent consanguinity. The 45 affected individuals recruited for the study are shaded and indicated with their respective subject (S) number (S1, S2 or S3). The segregation data for all individuals tested via Sanger sequencing are shown with the presence of the ACBD6 variant (red) and/or the reference allele (black), two red/black texts indicate a homozygous state and one red + one black text indicates a heterozygous state. The genotyping is based on the coding DNA sequence. DEL = deletion; DUP = duplication; WT = wild-type. (B) Top: Schematic representation of the gene and protein positions of detected variants in ACBD6. ACBD6 is located on chromosome 1 at cytogenetic position q25.2q25.3. Middle: The genetic variants mapped to the NM_032360.4 transcript of ACBD6. Bottom: ACBD6 variants mapped on the protein level. Three variants, including p.(Gly22fs), p.(Leu121ThrfsTer27) and a 30 kb deletion in the C-terminus, have been reported previously.6,7,10 Recurrent variants are labelled with family codes. (C) Splicing schematic for the c.574-2A>G (top) variant in ACBD6 showing cryptic acceptor splice site activation in exon 6. The c.664-2A>G (middle) and c.694+1G>A (bottom) variants affect splicing of exon 7 both show exon skipping. Additionally, the c.694+1G>A variant activates a cryptic donor splice site. (D) Interspecies alignment performed with Clustal Omega showing the complete conservation down to invertebrates of the amino acid residues affected by a missense variant leading to an amino acid substitution p.(Asp201Gly) and an in-frame duplication p.(Asn219dup).

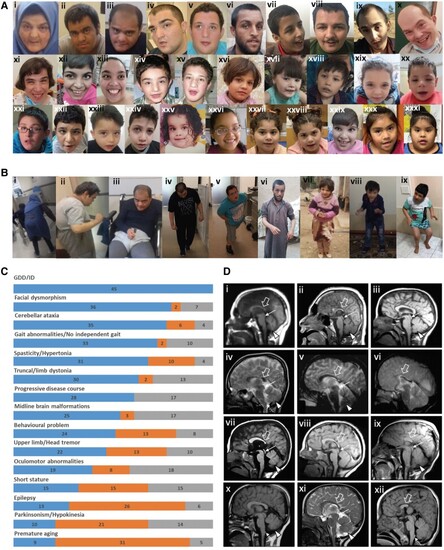
Clinical features of the affected individuals with bi-allelic ACBD6 variants. [A(ixiii)] Representative photographs demonstrating facial features of the affected individuals in adulthood: F1:S1 (i); F1:S2 (ii); F1:S3 (iii); F3:S2 (iv); F3:S1 (v); F6:S1 (vi); F7:S2 (vii); F7:S1 (viii); F11:S1 (ix); F17:S1 (x); F17:S2 (xi); F20:S1 (xii); and F16:S1 (xiii). [A(xivxxxi)] Representative photographs demonstrating facial features of the affected individuals in childhood: F3:S2 (xiv) at 5 years old; F3:S1 (xv) at 12 years old; F6:S2 (xvi); F8:S1 (xvii); F8:S2 (xviii); F10:S1 (xix); F10:S2 (xx); and F11:S1 (xxi) at younger age; F13:S1 (xxii); F14:S1 (xxiii); F15:S1 (xxiv); F16:S1 (xxv) at 2 years old; F16:S1(xxvi) at 4 years old; F19:S1 (xxvii); F19:S2 (xxviii); F20:S2 (xxix); F12:S1 (xxx); and F12:S2 (xxxi). The most frequently seen facial dysmorphologies in adults are high nasal ridge, full nasal tip, small mouth, thin upper lip and broad chin. The most frequently seen facial dysmorphologies in children are bifrontal/bitemporal narrowing, arched eyebrows, hypertelorism, up-slanting palpebral fissures, depressed nasal bridge, full nasal tip, thin upper lip, full lower lip and broad chin. [B(iix)] Representative photographs demonstrating postural abnormalities seen in the affected individuals. A stooped body posture and lateral flexion of the trunk can be seen in the individuals F1:S1 (i), F1:S2 (ii), F1:S3 (iii), F3:S1 (iv), F3:S2 (v), F6:S1 (vi), F6:S2 (vii), F8:S2 (viii) and F13:S1 (ix). (C) Bar graph summarizing proportions of various clinical findings in the ACBD6 cohort. Blue = affected; orange = unaffected; grey = not ascertained/not applicable. GDD = global developmental delay; ID = intellectual disability. [D(ixii)] Representative neuroimaging features of the affected individuals. Brain MRI, midline sagittal images of the affected individuals F1:S1 (i), F1:S2 (ii), F5:S1(iii), F56:S2 (iv), F7:S1 (v), F7:S2 (vi), F10:S1 (vii), F10:S2 (viii), F11:S1 (ix), F13:S1 (x), F14:S1 (xi) and F19:S1 (xii). Most of the affected individuals have corpus callosum agenesis or hypoplasia with prevalent involvement of the posterior sections (empty arrows), variably associated with short midbrain (thin arrows) and small inferior cerebellar vermis (arrowheads). In addition, mild hypertrophy of the clava was noted in some subjects (dotted arrows). Note that the anterior commissure was markedly hypoplastic or absent in all affected individuals.

CRISPR/Cas9 mutation of zebrafish acbd6 causes smaller eyes, impaired vision, abnormal locomotion, developmental delay and increased mortality. (A) Whole-mount in situ hybridization for detecting acbd6 mRNA expression pattern in zebrafish embryo at 24 hours post-fertilization (hpf). fb = forebrain; mb = midbrain; MHB = midbrain and hindbrain boundary; hb = hindbrain; ov = otic vesicle. Dorsal view to the top, anterior to the left. (B) Representative images of wild-type (acbd6+/+), heterozygous (acbd6+/−) and homozygous (acbd6−/−) mutant larva at 6 days post-fertilization (dpf). Head size and eye size are indicated by blue and red lines, respectively. Anterior to the left and dorsal to the top. Scale bar = 200 μm. (C and D) Quantification of eye and head size as indicated in B. +/+ (n = 26 larvae), +/− (n = 114 larvae) and −/− (n = 47 larvae). Each symbol represents one larva. Values are calculated as a percentage of the mean value of +/+ larvae. Error bars = mean ± standard deviation (SD). (E) The result of visual startle response analysis performed on +/+ (n = 43 larvae), +/− (n = 99 larvae) and −/− (n = 48 larvae) zebrafish larvae at 6 dpf. Each symbol represents one larva. The number of responses for five stimuli of each larva is calculated as a percentage of responses. Error bars = mean ± standard error of the mean (SEM). (F) Locomotor activities of zebrafish larvae in light and dark periods at 6 dpf. +/+ (n = 42 larvae), +/− (n = 99 larvae) and −/− (n = 48 larvae) zebrafish larvae were habituated in the dark for 30 min, followed by three cycles of 10-min time bins of light and dark periods. Black arrows indicate the increased movement of homozygous mutants at the first minute in the dark. Error bars = mean ± SEM. D = dark period; L = light period. (G) Average cumulative distance travelled by each larva from three cycles of either light or dark periods in F. Error bars = mean ± SD. (H) Average cumulative distance travelled by each larva during the first minute of the dark period across three cycles as indicated by black arrows in F. Error bars = mean ± SD. (I) Locomotor activities of zebrafish larvae in light and dark conditions at 12 dpf. +/+ (n = 39 larvae), +/− (n = 71 larvae) and −/− (n = 29 larvae). Error bars = mean ± SEM. Red arrow indicates increased movement of homozygous mutants at the first minute after light on. Red arrowhead indicates increased movement of homozygous mutants at the second minute after light on. (J) Average cumulative distance travelled by each larva during three cycles of either light or dark periods in I. Error bars = mean ± SD. (K) Average cumulative distance travelled by each larva during the first cycle of the first minute of the light period as indicated by red arrow in I. Error bars = mean ± SD. (L) Genotyping results of zebrafish at 6 dpf (n = 191 larvae), 12 dpf (n = 196 larvae) and 30 dpf (n = 118 juveniles) stages from acbd6+/− intercross. (M) Representative images of morphological phenotype from acbd6+/+, acbd6+/− and acbd6−/− at 30 dpf. Anterior to the left and dorsal to the top. (N) Sagittal section of acbd6+/+ brain at 30 dpf. Anterior to the left and dorsal to the top. MO = medulla oblongata; Ob = olfactory bulb; PGZ = periventricular grey zone of optic tectum. (OW) Representative images of transverse sections of telencephalon (OQ), optic tectum (RT) and cerebellum (UW) from acbd6+/+, acbd6+/− and acbd6−/− juvenile as indicated in N. In C and D, one-way ANOVA with Tukey’s multiple comparisons test; in E, G, H, J and K, one-way ANOVA with Dunnett’s T3 multiple comparisons test; ns, not significant; *P < 0.05; **P < 0.01; ***P < 0.001; ****P < 0.0001.

Zebrafish acbd6 F0 knockouts exhibit increased susceptibility to chemical-induced seizures, excessive motor neuron branching and skeletal muscle degeneration. (A) Representative images of uninjected control and acbd6 F0 larvae at 6 days post-fertilization (dpf). Left: Ventral view, anterior to the left. Right: Dorsal view, anterior to the left. Blue line indicates head size; magenta line indicates eye size; and cyan line indicates eye distance. Scale bar = 0.2 mm. (B and C) Quantification of the head and eye size (n = 30 larvae for each group) of uninjected control (uninj.), acbd6 F0 knockout (F0), F0 + zebrafish wild-type acbd6 mRNA (+acbd6) and F0 + human wild-type ACBD6 mRNA (+ACBD6) as indicated in B. (D) The visual startle response (VSR) analysis after mRNA rescue at 6 dpf. n = 36 larvae for each group. Each symbol represents one larva. The number of responses to five stimuli of each larva was calculated as a percentage of responses. Error bars = mean ± standard error of the mean (SEM). (E) Quantification of the eyes distance (n = 20 larvae for each group) as indicated in B. (F) Quantification of the eye size of F0 knockout rescued with mRNA of human p.Glu63Ter (+E63*) or p.Asp201Gly (+D201G) variant. n = 25 larvae for each group. (G) Locomotor activities of zebrafish larvae in light and dark conditions at 6 dpf. n = 64 larvae for each group. The larvae were habituated in the dark for 30 min, followed by three cycles of 10-min periods of light and dark. Error bars represent the mean ± SEM. D = dark period; L = light period. Red arrows indicate increased movement of F0 1 min after light on, and black arrows indicate increased movement 1 min after light off. (H) Average cumulative distance travelled by each larva during three cycles of either light or dark periods in G. Error bars = mean ± standard deviation (SD). (I) The average cumulative distance traveled by each larva during the first minute of the dark period was measured over three cycles, as shown by the black arrow in G. Error bars represent the mean ± SD. (J) The average cumulative distance traveled by the larvae was measured for each group after being treated with different doses of pentylenetetrazole (PTZ) at 5 dpf. n = 16 larvae for each group. (KN) Confocal images of Tg(mnx1:GFP; olig2:DsRed) larva at 12 dpf are shown, with transgenic larvae injected with slc45a2 sgRNA used as a control and those injected with acbd6 + slc45a2 sgRNAs shown as acbd6 F0. (L' and N') Enlarged images from white boxes are shown in L' and N', with red asterisks indicating autofluorescence from remaining pigment cells. GFP and DsRed are displayed in cyan and magenta, respectively, with magenta arrowheads indicating excess axonal arborizations. The images are presented in a lateral view, with anterior to the left and dorsal to the top. Additional motor neuron phenotypes at 6 and 12 dpf can be found in Supplementary Fig. 13. (OT) Confocal images of stained skeletal muscle fibers with phalloidin are presented, including images from slc45a2 sgRNA-injected control (OQ) and acbd6 + slc45a2 sgRNA-injected (R and S) larvae at 12 dpf. Orthogonal views generated from P and S using the Orthogonal views tool in ImageJ are also displayed. #Degenerated muscles. White arrowheads and a white arrow indicate Z-discs and the thickness of the myotube, respectively. Supplementary Fig. 14 provides additional muscle phenotypes at 6 and 12 dpf. In BD and F, one-way ANOVA with Tukey’s multiple comparisons test; E and HJ, one-way ANOVA with Dunnett’s T3 multiple comparisons test; ns, not significant; *P < 0.05; **P < 0.01; ***P < 0.001; ****P < 0.0001.

Xenopus tropicalis (acbd6) crispants have gastrulation, movement, craniofacial, brain and eye defects together with microcephaly. (A) The gene structure of human (ACBD6) and X. tropicalis (acbd6) reveals eight exons. (B) Gastrulation defects, including failure of blastopore closure and anterior posterior defects, were observed in F0X. tropicalis embryos injected with two different CRISPR/Cas9 constructs (sgRNA-68 and sgRNA-71) disrupting exon 1 of acbd6. (C) Those animals surviving to free-feeding stages presented with microcephaly, craniofacial dysmorphism and eye abnormalities. (D) The differences in head size between the uninjected control (2.07 ± 0.36 mm) and acbd6 crispant tadpoles (1.52 ± 0.27 mm, sgRNA-68) were found to be significant, t(34) = 5.183, P < 0.001. (E and F) Alcian blue staining marking the cartilaginous structures in the head and neck show equivalent structures between control (E) and acbd6 crispant tadpoles (F), revealing no gross morphological abnormalities. (G) Detailed structural analysis in higher resolution microCT imaging (1% phosphotungstic acid contrast stain) revealed significant structural abnormalities in the facial musculature (red arrows; G), abnormalities of the eye (microphthalmia, anophthalmia; yellow arrows, G) and structural abnormalities in the brain most pronounced in the midbrain regions (blue arrow, G). (H) Locomotion analysis at NF44/45 revealed that crispants moved significantly less than control tadpoles. (I) The Kaplan–Meier survival analysis of 65 control and crispant tadpoles shows two periods of crispant-specific decline, the first at gastrula stages (Day 0–1) and the second with post-feeding [Day 8, Nieuwkoop and Faber (NF) stage 47].

Morphological characteristics of peroxisomes in ACBD6-deficient patient cells are not altered and chemical proteomic profiling of N-myristoylation in human fibroblasts. (A) Patient fibroblasts and controls were processed for immunofluorescence microscopy using antibodies against the peroxisomal membrane marker PEX14, the matrix marker catalase or mitochondrial ATP synthetase B (ATPB). Peroxisomal localization of PEX14 and catalase indicate that peroxisomal membrane and PTS1-dependent matrix import are normal. Note that the morphology of mitochondria, which are elongated in fibroblasts, was also not altered when compared to controls. (B) Quantification of peroxisome number based on immunofluorescence images (see A for representative images) (n = 29–36 cells). Data are from three independent experiments. ns, not significant; Kruskal–Wallis ANOVA test with Dunn’s multiple comparisons. (C) COS-7 cells were transfected with plasmids encoding Myc-ACBD5 or Myc-ACBD6 and processed for immunofluorescence microscopy using antibodies against Myc and PEX14. Note that Myc-ACBD5 localizes to peroxisomes, whereas Myc-ACBD6 localizes to the nucleus and the cytoplasm in COS-7 cells. Scale bars = 10 µm. (D) Ranked plot of myristic acid alkyne (YnMyr)-labelled, known co- and post-translationally N-myristoylated proteins, as identified in Supplementary Fig. 18E. Position on the left equals lower abundance in ACBD6 deficient fibroblasts, position on the right equals higher abundance in ACBD6 deficient fibroblasts.

Chemical and whole proteome analysis of acbd6 wild-type and crispant zebrafish and Xenopus tropicalis model systems. (A) Volcano plot comparing myristic acid alkyne (YnMyr) labelling of proteins in wild-type and acbd6 crispant zebrafish at 72 h post-fertilization (hpf). (B) Comparing YnMyr labelling of proteins in wild-type and acbd6 crispant zebrafish at 120 hpf. Further description as in A. (C) Top 20 biological processes most significantly enriched in proteins downregulated in acbd6 crispant zebrafish at 72 hpf. (D) Volcano plot comparing YnMyr labelling of proteins in wild-type and acbd6 crispant 68 X. tropicalis. (E) Comparing YnMyr labelling of proteins in wild-type and acbd6 crispant 71 X. tropicalis. Further description as in D. (F) Top 20 biological processes most significantly enriched in proteins upregulated in acbd6 crispant 68 X. tropicalis. Most significantly enriched processes are at the top. In A and D, position on the left equals reduced in crispant; position on the right equals increased in crispant. Horizontal dotted line indicates significance threshold (P = 0.05). FC = fold-change. In C and F, the most significantly enriched process is at the top. Colour indicates Q-value as secondary significance indicator. Size of circle indicates a number of proteins enriched in the depicted process. Dr = Danio rerio; Hs = Homo sapiens; Xt = X. tropicalis.

Acknowledgments
This image is the copyrighted work of the attributed author or publisher, and ZFIN has permission only to display this image to its users. Additional permissions should be obtained from the applicable author or publisher of the image. Full text @ Brain