IMAGE

Figure 3

ID
ZDB-IMAGE-240405-37
Source
Figures for Kaiyrzhanov et al., 2023
Image
Figure Caption

Figure 3

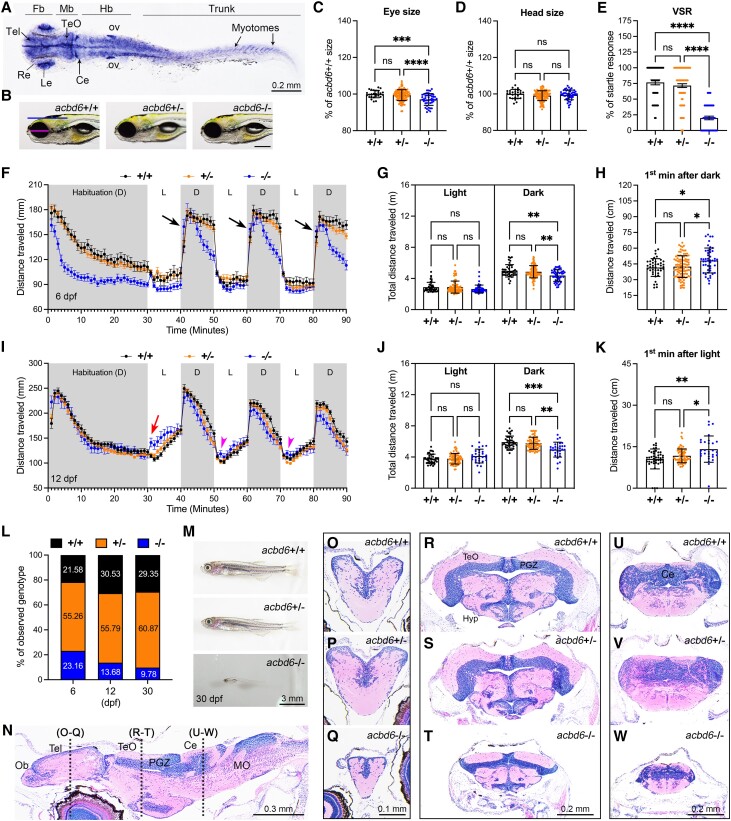
CRISPR/Cas9 mutation of zebrafish acbd6 causes smaller eyes, impaired vision, abnormal locomotion, developmental delay and increased mortality. (A) Whole-mount in situ hybridization for detecting acbd6 mRNA expression pattern in zebrafish embryo at 24 hours post-fertilization (hpf). fb = forebrain; mb = midbrain; MHB = midbrain and hindbrain boundary; hb = hindbrain; ov = otic vesicle. Dorsal view to the top, anterior to the left. (B) Representative images of wild-type (acbd6+/+), heterozygous (acbd6+/−) and homozygous (acbd6−/−) mutant larva at 6 days post-fertilization (dpf). Head size and eye size are indicated by blue and red lines, respectively. Anterior to the left and dorsal to the top. Scale bar = 200 μm. (C and D) Quantification of eye and head size as indicated in B. +/+ (n = 26 larvae), +/− (n = 114 larvae) and −/− (n = 47 larvae). Each symbol represents one larva. Values are calculated as a percentage of the mean value of +/+ larvae. Error bars = mean ± standard deviation (SD). (E) The result of visual startle response analysis performed on +/+ (n = 43 larvae), +/− (n = 99 larvae) and −/− (n = 48 larvae) zebrafish larvae at 6 dpf. Each symbol represents one larva. The number of responses for five stimuli of each larva is calculated as a percentage of responses. Error bars = mean ± standard error of the mean (SEM). (F) Locomotor activities of zebrafish larvae in light and dark periods at 6 dpf. +/+ (n = 42 larvae), +/− (n = 99 larvae) and −/− (n = 48 larvae) zebrafish larvae were habituated in the dark for 30 min, followed by three cycles of 10-min time bins of light and dark periods. Black arrows indicate the increased movement of homozygous mutants at the first minute in the dark. Error bars = mean ± SEM. D = dark period; L = light period. (G) Average cumulative distance travelled by each larva from three cycles of either light or dark periods in F. Error bars = mean ± SD. (H) Average cumulative distance travelled by each larva during the first minute of the dark period across three cycles as indicated by black arrows in F. Error bars = mean ± SD. (I) Locomotor activities of zebrafish larvae in light and dark conditions at 12 dpf. +/+ (n = 39 larvae), +/− (n = 71 larvae) and −/− (n = 29 larvae). Error bars = mean ± SEM. Red arrow indicates increased movement of homozygous mutants at the first minute after light on. Red arrowhead indicates increased movement of homozygous mutants at the second minute after light on. (J) Average cumulative distance travelled by each larva during three cycles of either light or dark periods in I. Error bars = mean ± SD. (K) Average cumulative distance travelled by each larva during the first cycle of the first minute of the light period as indicated by red arrow in I. Error bars = mean ± SD. (L) Genotyping results of zebrafish at 6 dpf (n = 191 larvae), 12 dpf (n = 196 larvae) and 30 dpf (n = 118 juveniles) stages from acbd6+/− intercross. (M) Representative images of morphological phenotype from acbd6+/+, acbd6+/− and acbd6−/− at 30 dpf. Anterior to the left and dorsal to the top. (N) Sagittal section of acbd6+/+ brain at 30 dpf. Anterior to the left and dorsal to the top. MO = medulla oblongata; Ob = olfactory bulb; PGZ = periventricular grey zone of optic tectum. (OW) Representative images of transverse sections of telencephalon (OQ), optic tectum (RT) and cerebellum (UW) from acbd6+/+, acbd6+/− and acbd6−/− juvenile as indicated in N. In C and D, one-way ANOVA with Tukey’s multiple comparisons test; in E, G, H, J and K, one-way ANOVA with Dunnett’s T3 multiple comparisons test; ns, not significant; *P < 0.05; **P < 0.01; ***P < 0.001; ****P < 0.0001.

Acknowledgments
This image is the copyrighted work of the attributed author or publisher, and ZFIN has permission only to display this image to its users. Additional permissions should be obtained from the applicable author or publisher of the image. Full text @ Brain