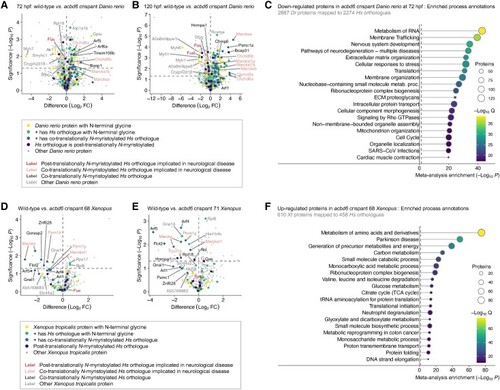
Chemical and whole proteome analysis of acbd6 wild-type and crispant zebrafish and Xenopus tropicalis model systems. (A) Volcano plot comparing myristic acid alkyne (YnMyr) labelling of proteins in wild-type and acbd6 crispant zebrafish at 72 h post-fertilization (hpf). (B) Comparing YnMyr labelling of proteins in wild-type and acbd6 crispant zebrafish at 120 hpf. Further description as in A. (C) Top 20 biological processes most significantly enriched in proteins downregulated in acbd6 crispant zebrafish at 72 hpf. (D) Volcano plot comparing YnMyr labelling of proteins in wild-type and acbd6 crispant 68 X. tropicalis. (E) Comparing YnMyr labelling of proteins in wild-type and acbd6 crispant 71 X. tropicalis. Further description as in D. (F) Top 20 biological processes most significantly enriched in proteins upregulated in acbd6 crispant 68 X. tropicalis. Most significantly enriched processes are at the top. In A and D, position on the left equals reduced in crispant; position on the right equals increased in crispant. Horizontal dotted line indicates significance threshold (P = 0.05). FC = fold-change. In C and F, the most significantly enriched process is at the top. Colour indicates Q-value as secondary significance indicator. Size of circle indicates a number of proteins enriched in the depicted process. Dr = Danio rerio; Hs = Homo sapiens; Xt = X. tropicalis.
|
