
- Title
-
Cadmium exposure promotes ferroptosis by upregulating Heat Shock Protein 70 in vascular endothelial damage of zebrafish
- Authors
- Zhang, T., Yan, W., Liu, C., Duan, W., Duan, Y., Li, Y., Yu, Q., Sun, Y., Tian, J., Zhou, J., Xia, Z., Wang, G., Xu, S.
- Source
- Full text @ Ecotoxicol. Environ. Saf.

Cd exposure leads to vascular endothelial damage in zebrafish embryos. (A) Confocal images of control or 50, 100, and 200 μM CdCl2-treated Tg (kdrl:mCherry) zebrafish embryos and Leadamium™ Green AM dye at 72 hpf. The scale bars indicate 100 µm and 25 µm (enlarged). (B) Quantitation of Cd accumulation in mCherry+ ECs in CdCl2-treated or control embryos. ND means not detected. (C) Confocal images of control, 50, 100 or 200 μM CdCl2-treated Tg (fli1a:nGFP;kdrl:mCherry) embryos at 72 hpf. The scale bars indicate 500 µm and 100 µm (enlarged). The number of ECs (D) and relative area (E) of the CVP were counted. (F) Immunofluorescence illustrates CD31 (green) and Gpx4 (red) localization near the vessel with DAPI (blue). The scale bars indicate 10 µm. (G) Relative quantification of Gpx4 in Cd31+ ECs. (n = 5). The values are presented as the mean ± SEM in histograms or as median (line), while whiskers mean min to max levels in boxplots. *P < 0.05, **P < 0.01 and ***P < 0.001 (unpaired t test or one-way ANOVA followed by multiple comparisons). |

Cd-induced vascular endothelial damage was abrogated/exacerbated by Fer-1/Erastin in zebrafish embryos. (A) Zebrafish embryos were pretreated with ferrostatin-1 (Fer-1, 1 μM) or erastin (5 μM) and co-treated with 100 μM CdCl2. ROS were observed by fluorescence microscopy, and the relative level of ROS was counted (B). The contents of LPO and MDA (C) per mg weight were examined, and the fold changes in GSH, GSSG (D) and GSH/GSSG (E) were observed under Cd stress. (F) kdrl:mCherry × fli1a:nGFP+ ECs in the tail were observed. The number of ECs (G) and relative area of CVP (H) with various treatments were counted (n = 5). The values are presented as the mean ± SEM in histograms or as median (line), while whiskers mean min to max levels in boxplots. *P < 0.05, **P < 0.01 and ***P < 0.001 (unpaired t test or one-way ANOVA followed by multiple comparisons). |

Transcriptome analysis of zebrafish embryos exposed to Cd at 48 and 72 hpf. (A) Volcano plots illustrating the distribution of DEGs in zebrafish embryos treated with 100 μM CdCl2. (B) Venn diagram illustrating the overlap of DEGs between Cd-exposed and control groups. (C) Histogram for GO enrichment analysis of DEGs in zebrafish embryos exposed to Cd, with the numbers of DEGs indicated. (D, E) The top 20 significantly enriched KEGG pathways in zebrafish embryos in response to Cd. (F) Heatmap displaying ferroptosis-related genes between control and Cd-treated zebrafish embryos. (G, H) GSEA of genes related to ferroptosis in Cd-treated zebrafish embryos at 48 and 72 hpf. |
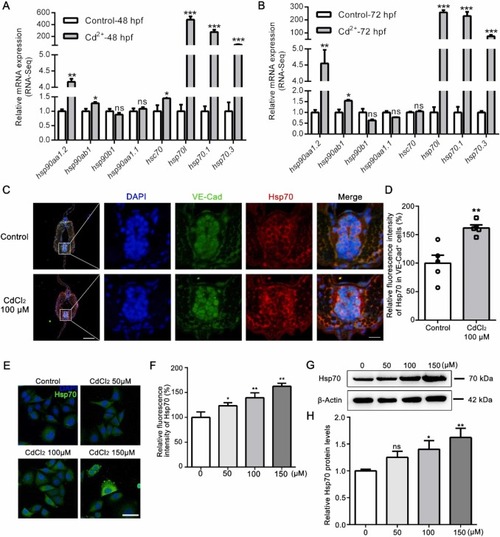
Excessive Hsp70 in vascular endothelial cells during Cd exposure. RNA-seq analysis verification of gene expression related to the heat shock protein family at 48 hpf (A) and 72 hpf (B). (C) Immunofluorescence illustrated VE-Cad and Hsp70 localization in the vessel. The scale bars indicate 50 µm and 10 µm (enlarged). (D) Relative quantification of Hsp70 in VE-Cad+ ECs was performed (n = 5). (E) Immunofluorescence of HUVECs demonstrated upregulation of Hsp70 after treatment with CdCl2 for 24 h. Scale bar = 50 µm. (F) Relative quantification of Hsp70 in HUVECs (n = 6). (G) Representative immunoblots and (H) quantification for Hsp70 in lysates from quiescent HUVECs grown in CdCl2 treatment with a concentration gradient for 24 h. Error bars represent the mean ± SEM. * p < 0.05, ** p < 0.01, *** p < 0.001 (unpaired t test or one-way ANOVA followed by multiple comparisons. |

Hsp70 activation is critical for Cd-induced ferroptosis in vascular endothelial cells of zebrafish embryos. (A) Zebrafish embryos were pretreated with Ver (2.5 μM) and co-treated with 100 μM CdCl2. fli1a:nGFP+ ECs in the tail were observed. The scale bars indicate 500 µm and 100 µm (enlarged). The number of ECs (B) and relative area of CVP (C) were counted. The contents of LPO and MDA (D) per mg weight were examined, and the fold changes in GSH, GSSG (E) and GSH/GSSG (F) was exhibited. (G) Relative quantification of Gpx4 in Cd31+ ECs was performed. (H) Immunofluorescence illustrates CD31 and Gpx4 localization near the vessel. Scale bar = 10 µm. (n = 4). The values are presented as the mean ± SEM in histograms or as median (line), while whiskers mean min to max levels in boxplots. *P < 0.05, **P < 0.01 and ***P < 0.001 (one-way ANOVA with uncorrected Dunn’s post-test for differences between all treated groups). |

Hsp70 knockdown rescued Cd-induced ferroptosis. (A) qRTsingle bondPCR verified the expression of ferroptosis-related genes and Hsp70 in CdCl2-treated HUVECs after Hsp70 knockdown. Representative immunoblots (B) and quantification (C) of ferroptotic proteins and Hsp70 in HUVECs were reversed after Hsp70 knockdown. (D) Bright field of HUVECs under Cd exposure after Hsp70 knockdown. (E) Hsp70 knockdown ameliorated the compromised viability of HUVECs after Cd exposure. Data represent the mean ± SEM. ** p < 0.01(Control vs. Cd-treated group); # p < 0.05, ## p < 0.01 (Cd-treated group vs. si-Hsp70 +Cd-treated group) (one-way ANOVA with uncorrected Dunn’s post-test for differences between all treated groups). |
|