
- Title
-
Deletion of the foxO4 Gene Increases Hypoxia Tolerance in Zebrafish
- Authors
- Shi, L., Zhang, A., Liu, H., Wang, H.
- Source
- Full text @ Int. J. Mol. Sci.

Effect of hypoxia on the expression of foxO4 mRNA. (A) Protein detection of Hif1α in ZF4 cells treated with 100 μM CoCl2 for 0 to 24 h. (B,C) Expression of hif1α and foxO4 in ZF4 cells treated with 100 μM CoCl2 for 0 to 24 h. (D,E) Expression of hif1α and foxO4 in adult zebrafish treated with 10% O2 for 24 h.* p < 0.05, ** p < 0.01, *** p < 0.001. |
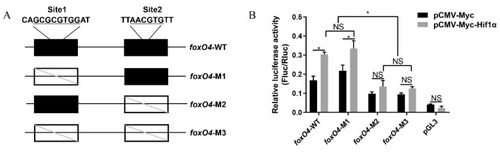
Luciferase reporter gene assay validates Hif1α targeting foxO4. (A) A schematic depiction of the foxO4 promoter region containing two putative Hif1α binding sites. Underlined letters indicate hypoxia response element sequence. Black boxes indicate sites. Blank boxes indicate disrupted sites. (B) Luciferase reporter assay for foxO4 promoter constructs. NS: Not significant. * p < 0.05. |

Generation of foxO4−/− zebrafish via CRISPR/Cas9 technology. (A) The DNA sequence and predicated protein product difference in foxO4 between the mutants and WT. sgRNA sequence is marked with a black box. The green letters in MT represent the mutated DNA sequence. (B) Verification of zebrafish |
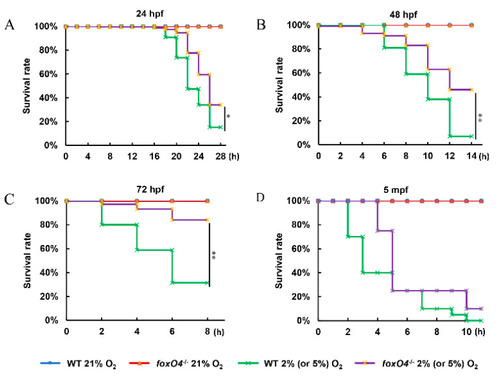
Survival rate curves. Hypoxia treatment with 2% O2 was performed in foxO4−/− and WT zebrafish at different development stages with 24 hpf (A), 48 hpf (B) and 72 hpf (C). Hypoxia stress in 5 mpf adult zebrafish (D) with 5% O2. hpf: day after fertilization. mpf: month after fertilization. * p < 0.05, ** p < 0.01, * or ** represents the difference in the overall survival curve. |

Hemoglobin, oxygen consumption and locomotor activity. (A) O-dianisidine staining for hemoglobin in foxO4−/− and WT zebrafish embryos from 36 hpf to 96 hpf. Scale bar = 250 µm. (B) The ratio of total strength of foxO4−/− zebrafish staining signal to WT. ImageJ software was used to quantify the total strength of the staining signal of each embryo. (C) Oxygen consumption of foxO4−/− and WT adult zebrafish. (D) Locomotor activity of foxO4−/− and WT zebrafish embryos and adults. * p < 0.05, ** p < 0.01, *** p < 0.001. |
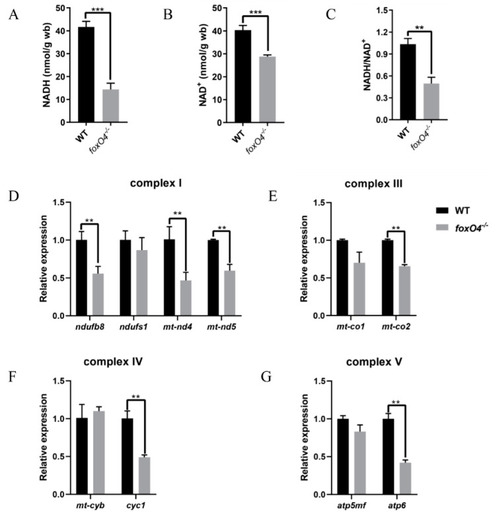
NAD(H) content and expression of mitochondrial respiratory function-regulated genes. NADH (A) and NAD+ (B) contents and NADH/NAD+ rate (C) in muscle tissue of foxO4−/− and WT adult zebrafish. Expression of genes associated with mitochondrial respiratory complexes I (D), III (E), IV (F) and V (G). Gene expression level was normalized to ef1a. ** p < 0.01, *** p < 0.001. |