
FIGURE
Figure 4
- ID
- ZDB-FIG-230529-87
- Publication
- Shi et al., 2023 - Deletion of the foxO4 Gene Increases Hypoxia Tolerance in Zebrafish
- Other Figures
- All Figure Page
- Back to All Figure Page
Figure 4
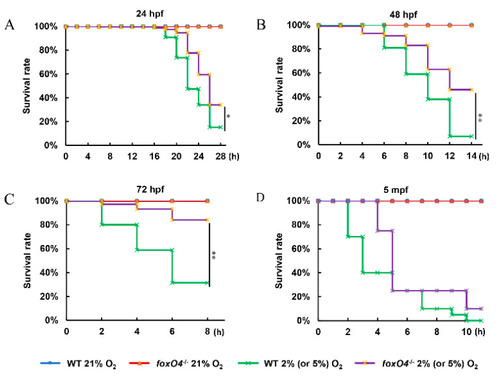
Survival rate curves. Hypoxia treatment with 2% O2 was performed in foxO4−/− and WT zebrafish at different development stages with 24 hpf (A), 48 hpf (B) and 72 hpf (C). Hypoxia stress in 5 mpf adult zebrafish (D) with 5% O2. hpf: day after fertilization. mpf: month after fertilization. * p < 0.05, ** p < 0.01, * or ** represents the difference in the overall survival curve. |
Expression Data
Expression Detail
Antibody Labeling
Phenotype Data
Phenotype Detail
Acknowledgments
This image is the copyrighted work of the attributed author or publisher, and
ZFIN has permission only to display this image to its users.
Additional permissions should be obtained from the applicable author or publisher of the image.
Full text @ Int. J. Mol. Sci.