
- Title
-
Age-dependent dysfunction of the cerebrovascular system in the zebrafish telencephalon
- Authors
- Mizoguchi, T., Okita, M., Minami, Y., Fukunaga, M., Maki, A., Itoh, M.
- Source
- Full text @ Exp. Gerontol.

Illustration of the live imaging method. The fish were fixed by the sponge. A peristaltic pump was used to supply 0.04 % anesthetic to the mouth of the fish at a flow rate of 3–5 ml/min. Imaging was performed by confocal microscopy. The illustration was created with BioRender.com . |

The tortuosity of cerebral blood vessels was increased by aging. (A) Representative image of the change in vascular patterning. Projection images of the green channel (kdrl:EGFP) in the same fish (3, 8, and 12 mpf). Scale bar, 500 μm. (B) Tracing of the vascular vessel pattern. Semitransparent green lines indicate the vascular pattern of the dorsal telencephalon. Each panel corresponds to (A). Yellow arrowheads indicate examples of newly formed vascular vessels, and magenta arrowheads indicate disappeared vascular vessels. (C) Calculation method of tortuosity. (D) Tortuosity increased with aging. Black dots indicate each value of segmented vessel tortuosity and red lines indicate mean and S.D. On average, about 340 segmented vessels per individual fish were measured. See method section for details on how to calculate tortuosity. Number of observed fish are 10 (2 mpf), 13 (3 mpf), 12 (4 mpf), 30 (5 mpf), 19 (6 mpf), 17 (7 mpf), 16 (8 mpf), 15 (9 mpf), 13 (10 mpf), 17 (11 mpf), 15 (12 mpf), 13 (13 mpf), 10 (14 mpf), 12 (15 mpf), 8 (16 mpf). *, ***, **** shows a significant difference compared to 2 mpf (*, p < 0.05; ***, p < 0.001; ****, p < 0.0001, one-way ANOVA and Tukey's HSD test.) (E) High tortuosity rate (HTR) increased with aging. HTR was calculated from data showed in (D). Each bar shows the mean value, and the error bar shows S.D. * shows a significant difference (p < 0.05), one-way ANOVA and Tukey's HSD test. n = 10 (2 mpf), 13 (3 mpf), 12 (4 mpf), 30 (5 mpf), 19 (6 mpf), 17 (7 mpf), 16 (8 mpf), 15 (9 mpf), 13 (10 mpf), 17 (11 mpf), 15 (12 mpf), 13 (13 mpf), 10 (14 mpf), 12 (15 mpf), 8 (16 mpf). (For interpretation of the references to colour in this figure legend, the reader is referred to the web version of this article.) |
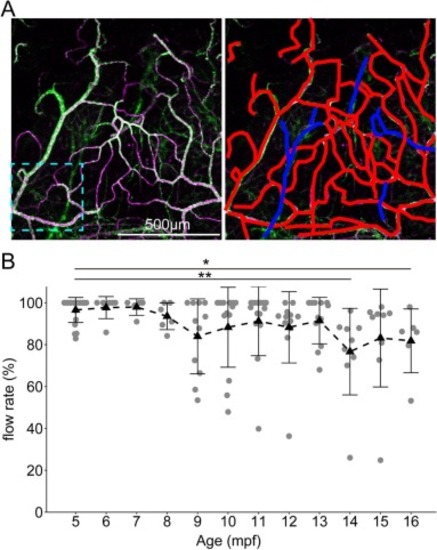
Blood flow decreased with aging. (A) Left panel: representative image of the merged view of vascular endothelial (green) and blood flow (magenta) in the dorsal telencephalon. The cyan dotted area corresponds to Fig. S2. Right panel: vessels with blood flow (red) and those without blood flow (blue) were identified, and the blood flow rate (the ratio of the length of a blood vessel with blood flow to the total length of the blood vessel) was calculated. See method section for details on how to take blood vessel images. Scale bar, 500 μm. (B) The BFR was decreased by aging. Grey dots indicate individual BFR values in telencephalon. Block triangles show the mean, and error bars indicate S.D. * and ** show significant differences compared to 5 mpf. *, p < 0.05; ***, p < 0.01, Kruskal–Wallis test and Dunn-Bonferroni post hoc test. n = 20 (5 mpf), 7 (6 mpf), 5 (7 mpf), 6 (8 mpf), 11 (9 mpf), 13 (10 mpf), 14 (11 mpf), 12 (12 mpf), 12 (13 mpf), 9 (14 mpf), 9 (15 mpf), 6 (16 mpf). See method section for details on how to calculate BFR. (For interpretation of the references to colour in this figure legend, the reader is referred to the web version of this article.) |

Spontaneous cerebral bleeding tends to increase with aging. (A) Representative images of cerebral bleeding at 5 mpf and 13 mpf. Arrowheads indicate the bleeding site. Scale bar, 500 μm. (B) Spontaneous bleeding in the dorsal telencephalon was observed at most ages examined. Each bar indicates the percentage of fish that showed cerebral hemorrhage. Blue shows the rate of fish surviving into the next month, and magenta shows the rate of fish that died during that month. n = 10 (2 mpf), 13 (3 mpf), 12 (4 mpf), 30 (5 mpf), 19 (6 mpf), 17 (7 mpf), 16 (8 mpf), 15 (9 mpf), 13 (10 mpf), 17 (11 mpf), 15 (12 mpf), 13 (13 mpf), 10 (14 mpf), 12 (15 mpf), 8 (16 mpf). (For interpretation of the references to colour in this figure legend, the reader is referred to the web version of this article.) |

Remodeling of the blood vessel patterning was observed at all ages examined. The graph shows the average number of newly formed and disappeared blood vessels in dorsal telencephalon every month. The light grey bar shows the average number of newly formed vessels compared to the previous month's data. The dark grey bar shows the average number of disappeared vessels compared to the previous month's data. Circles and triangles indicate individual values. Error bar, SD. n = 6 (3 mpf), 6 (4 mpf), 6 (5 mpf), 9 (6 mpf), 9 (7 mpf), 7 (8 mpf), 5 (9 mpf), 5 (10 mpf), 3 (11 mpf), 3 (12 mpf), 3 (13 mpf), 3 (14 mpf), 3 (15 mpf), 3 (16 mpf). *, p < 0.05, Kruskal–Wallis test and Dunn-Bonferroni post hoc test. |

The decrease in BFR is correlated with learning function in aged zebrafish. The graph shows the relationship between the BFR in dorsal telencephalon and the avoidance rate. The blue circles indicate the individual values of 5–6 mpf fish (n = 6). The green triangles indicate the individual values of 9 mpf fish (n = 11). The magenta squares indicate the individual values of 14 mpf fish (n = 13). Each dotted line indicates a regression line generated by least-squares analysis with Excel. The correlation coefficient values are 0.25 (5–6 mpf), −0.57 (9 mpf) and 0.64 (14 mpf). See material method for details on how BFRs are calculated. (For interpretation of the references to colour in this figure legend, the reader is referred to the web version of this article.) |

Aging affects the expression of vessel wall ECM-related genes. (A)The results of qRT–PCR analysis of gene expression. Each bar represents the average of the relative expression. The circles indicate the individual expression levels in young (4–5 mpf) fish (n = 7) and the triangles indicate the same in middle-old-aged (14–15 hpf) fish (n = 8). n.s. represents no significant difference; *, p < 0.05, ***; p < 0.001 (Welch's t-test). (B) Elastic fiber staining in the telencephalon of young and middle-old-aged fish. The results of resorcin-fuchsin and Van Gieson's staining in 5mpf and 17 mpf fish telencephalon section. Black purple-colored elastic fiber staining was reduced age-dependently. Blue dotted lines show the blood vessel in upper panels. Lower panels show the enlarged view of the white dotted line area in the upper panels. Blue dotted lines in lower panels indicate the vessel wall. Scale bars show 10 μm and 1 μm, respectively. (For interpretation of the references to colour in this figure legend, the reader is referred to the web version of this article.) |