
Fig. 3
- ID
- ZDB-FIG-231109-54
- Publication
- Mizoguchi et al., 2023 - Age-dependent dysfunction of the cerebrovascular system in the zebrafish telencephalon
- Other Figures
- All Figure Page
- Back to All Figure Page
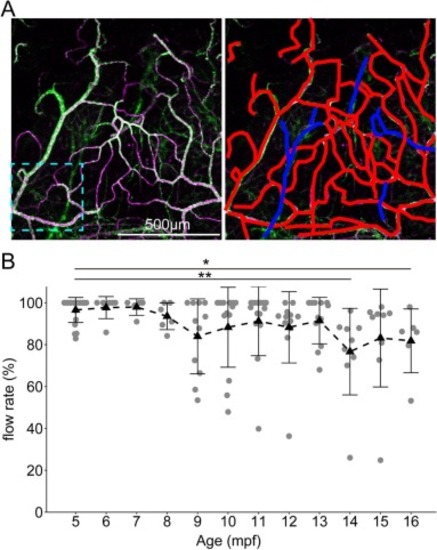
Blood flow decreased with aging. (A) Left panel: representative image of the merged view of vascular endothelial (green) and blood flow (magenta) in the dorsal telencephalon. The cyan dotted area corresponds to Fig. S2. Right panel: vessels with blood flow (red) and those without blood flow (blue) were identified, and the blood flow rate (the ratio of the length of a blood vessel with blood flow to the total length of the blood vessel) was calculated. See method section for details on how to take blood vessel images. Scale bar, 500 μm. (B) The BFR was decreased by aging. Grey dots indicate individual BFR values in telencephalon. Block triangles show the mean, and error bars indicate S.D. * and ** show significant differences compared to 5 mpf. *, p < 0.05; ***, p < 0.01, Kruskal–Wallis test and Dunn-Bonferroni post hoc test. n = 20 (5 mpf), 7 (6 mpf), 5 (7 mpf), 6 (8 mpf), 11 (9 mpf), 13 (10 mpf), 14 (11 mpf), 12 (12 mpf), 12 (13 mpf), 9 (14 mpf), 9 (15 mpf), 6 (16 mpf). See method section for details on how to calculate BFR. (For interpretation of the references to colour in this figure legend, the reader is referred to the web version of this article.) |