
- Title
-
Single-cell analysis reveals an Angpt4-initiated EPDC-EC-CM cellular coordination cascade during heart regeneration
- Authors
- Wu, Z., Shi, Y., Cui, Y., Xing, X., Zhang, L., Liu, D., Zhang, Y., Dong, J., Jin, L., Pang, M., Xiao, R.P., Zhu, Z., Xiong, J.W., Tong, X., Zhang, Y., Wang, S., Tang, F., Zhang, B.
- Source
- Full text @ Protein Cell
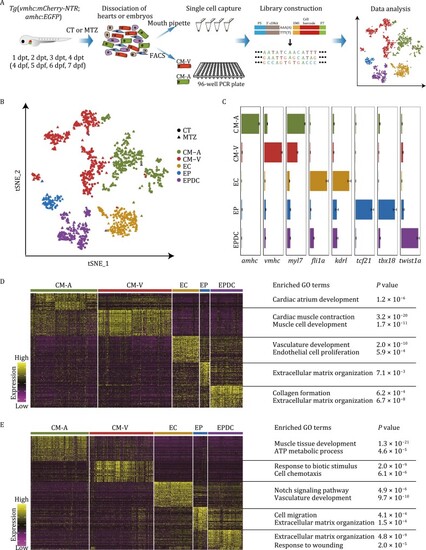
Single-cell RNA sequencing revealed molecular diversity of cells during zebrafish cardiac development and regeneration. (A) Schematic illustration of the workflow for the isolation of single cardiac cells followed by single-cell transcriptome analysis used in this study. CT, untreated control embryos; MTZ, MTZ-treated embryos; dpt, days post-treatment; dpf, days post-fertilization. (B) |
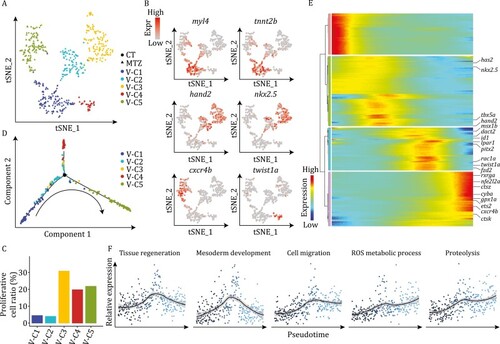
Molecular signatures of ventricular cardiomyocytes during development and regeneration. (A) t-SNE analysis results of CM-V from both untreated (CT) and MTZ-treated embryos, showing classification of five populations. Each dot represents a cell, and are colored according to the clusters and shaped by sample conditions. n = 510 cells. (B) t-SNE maps showing the expression patterns of myl4, tnnt2b, hand2, nkx2.5, cxcr4b, and twist1a in CM-V. (C) Cell cycle score analysis of CM-V subpopulations. (D) Pseudotime trajectory of the MTZ-treated CM-V colored by clusters identified in (A). Arrow indicates the order of pseudotime. (E) Heatmap visualization of changes in expression of representative genes following pseudotime of MTZ-treated CM-V. (F) Pseudotemporal expression patterns of different gene ontologies. Average expression levels smoothed using LOESS are shown. |

Angpt4 is a key regulator for embryonic and adult heart regeneration. (A) In situ hybridization results on tissue cryosections of adult wildtype zebrafish heart at different stages after cryoinjury. The results showed that angpt4 is transiently up-regulated during heart regeneration. Representative images of three independent replicates are shown. dpi, days post-cryoinjury. Scale bar, 100 μm. (B) qRT-PCR results showing the expression levels of angpt4 during heart regeneration. Two-tailed Student’s t-test, ns, not significant, **P < 0.01, ***P < 0.001. n = 5 for each group. Error bar represents standard deviation. (C) Immunostaining results of Angpt4 (green) and MF20 (red; labeling cardiomyocytes) in 7 dpi zebrafish heart cryosections. Right panel shows the enlarged view of the rectangle region. (D) Immunostaining results of Angpt4 (green) and EGFP (red) in Tg (fli1a:EGFP) heart cryosections at 7 dpi. Right panel shows the enlarged view of the rectangle region. (E) Immunostaining results of Angpt4 (green) and EGFP (red) in Tg (tcf21:CreER; ubi:loxP-dsRed-STOP-loxP-EGFP) heart sections at 7 dpi. ubi:loxP-dsRed-STOP-loxP-EGFP was abbreviated as ubi:RSG. Scale bar, 100 μm. Right panel shows the enlarged view of the rectangle region. Scale bar, 25 μm. (F) Maximum intensity projections of angpt4 mutant embryos with or without MTZ-treatment under Tg (vmhc:mCherry-NTR; amhc:EGFP) transgenic background, showing the failure to regenerate ventricular cardiomyocytes (marked by red fluorescent signal). dpf, days post fertilization. dpt, days post-treatment. Scale bar, 50 μm. (G) Statistical analysis results of successful regeneration ratio in MTZ-treated WT and angpt4 mutant embryos. Two-tailed Student’s t-test, ***P < 0.001. n = 8 for each group. Error bar represents standard deviation. (H–K) Statistical analysis results of ventricular volume (H), mCherry fluorescence intensity (I), ventricle fractional area (J) and atrium fractional area (K) in MTZ-treated WT and angpt4 mutant embryos. Fractional area change = (Diastolic area − Systolic area)/Diastolic area. Two-tailed Student’s t-test, *P < 0.05, ***P < 0.001. n = 4–10 for each group. Error bar represents standard deviation. (L) Representative Masson’s trichrome staining results of adult WT and angpt4−/− zebrafish heart cryosections prepared at 90 dpi. angpt4−/− hearts showed larger scar area than WT hearts. Red, muscle cells stained with acid fuchsin; blue, collagen stained with aniline blue. Dotted line indicates scar area. Scale bar, 100 μm. (M) Statistical analysis results of scar size in 90 dpi of WT and angpt4−/− hearts. Two-tailed Student’s t-test, ***P < 0.001. n = 9–10 for each group. Error bar represents standard deviation. (N) Immunofluorescence staining results of cardiomyocyte marker MF20 in WT and angpt4−/− hearts at 90 dpi. Dotted line indicates scar area. Scale bar, 100 μm. |

Angpt4 regulates heart regeneration by activating endocardial Tie2-MAPK signaling pathway. (A) Immunofluorescence staining results showing the pTie2 (Tyr992) signal in heart sections from WT at 7 days post sham operation, and WT and angpt4 mutant at 7 dpi. Scale bar, 100 μm. Right panels showed higher magnification views of the rectangle region. Arrows indicate pTie2-positive EC. Representative images of three independent replicates are shown. Red, pTie2; Green, EGFP, representing EC. Scale bar, 25 μm. (B) Statistical analysis results of relative pTie2 signals in 7 dpi of WT and angpt4−/− hearts. Two-tailed Student’s t-test, **P < 0.01, ***P < 0.001. n = 7 for each group. Error bar represents standard deviation. (C) Masson’s trichrome staining results of adult zebrafish heart cryosections from WT and Tie2 inhibitor treated WT fish at 90 dpi. Red, muscle cells stained with acid fuchsin; blue, collagen stained with aniline blue. Scale bar, 100 μm. (D) Statistical analysis results of scar size in 90 dpi WT and Tie2 inhibitor treated WT fish. Two-tailed Student’s t-test, ***P < 0.001. n = 6–10 for each group. Error bar represents standard deviation. (E) qRT-PCR results showing expression level of several components of the MAPK signaling pathway in 7 dpi WT or angpt4 mutant zebrafish hearts. Two-tailed Student’s t-test, ns, not significant, *P < 0.05, **P < 0.01, ***P < 0.001. n = 4 for each group. Error bar represents standard deviation. (F) Immunofluorescence staining of pERK in WT fish at 7 d post sham operation, and WT, angpt4 mutant, and Tie2 inhibitor treated WT heart sections at 7 dpi under Tg (fli1a:EGFP) transgenic background. Scale bar, 100 μm. Right panels show higher magnification views of the rectangular region. Arrows indicate pERK signals in EGFP-positive cells. Representative images of three independent replicates are shown. Red, pERK; Green, EGFP, representing EC. Scale bar, 25 μm. (G) Statistical analysis results of relative pERK signals in WT fish at 7 days post sham operation, and WT, angpt4 mutant, and Tie2 inhibitor treated WT fish at 7 dpi. Two-tailed Student’s t-test, *P < 0.05, ***P < 0.001. n = 6–8 for each group. Error bar represents standard deviation. (H) Masson’s trichrome staining results of adult zebrafish heart cryosections from angpt4 mutants and bpV treated angpt4 mutants at 90 dpi. Red, muscle cells stained with acid fuchsin; blue, collagen stained with aniline blue. Scale bar, 100 μm. (I) Statistical analysis results of scar size at 90 dpi in angpt4 mutants and bpV treated angpt4 mutants. Two-tailed Student’s t-test, **P < 0.01. n = 10 for each group. Error bar represents standard deviation. |
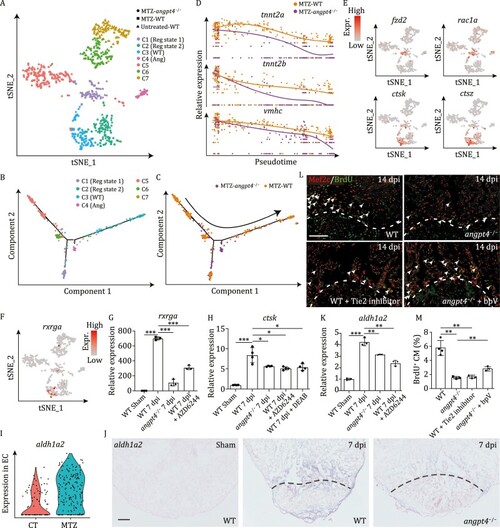
Single cell transcriptome analysis of ventricular cardiomyocytes from angpt4 mutant embryos during heart regeneration. (A) t-SNE analysis showing heterogeneity of CM-V from untreated and MTZ-treated wildtype (WT) embryos as well as MTZ-treated angpt4 mutant embryos. Cells are colored by clusters and shaped by sample conditions. Reg state, regeneration state; WT, WT specific population; Ang, angpt4 mutant specific population. (B and C) Pseudotime analysis using MTZ-treated wildtype (WT) and angpt4 mutant CM-V, colored by the clusters identified in panel A (B) and genotype (C), respectively. Arrow indicates the order of pseudotime. (D) The expression pattern of tnnt2a, tnnt2b, and vmhc following pseudotime in MTZ-treated wildtype (WT) embryos and angpt4 mutants. The expression pattern of WT and angpt4 mutants were fitted by Monocle2. (E) t-SNE maps derived from scRNA-seq data of ventricular cardiomyocytes from WT and angpt4 mutant embryos based on Fig. 5A, showing expression patterns of fzd2, rac1a, ctsk, and ctsz. (F) t-SNE maps derived from scRNA-seq data of ventricular cardiomyocytes from WT and angpt4 mutant embryos based on Fig. 5A, showing expression pattern of rxrga. (G) qRT-PCR results showing expression levels of rxrga in WT fish at 7 days post sham operation, and WT, angpt4 mutant, and MAPK signaling inhibitor AZD6244 treated WT zebrafish at 7 dpi. Two-tailed Student’s t-test, ***P < 0.001. n = 3 for each group. Error bar represents standard deviation. (H) qRT-PCR results showing ctsk expression level in WT fish at 7 days post sham operation, and WT, angpt4 mutant, MAPK signaling inhibitor AZD6244 treated WT, and RA signaling inhibitor DEAB treated WT zebrafish at 7 dpi. Two-tailed Student’s t-test, *P < 0.05, ***P < 0.001. n = 4 for each group. Error bar represents standard deviation. (I) Violin plot showing aldh1a2 was up-regulated in EC after MTZ treatment. (J) In situ hybridization results showing expression pattern of aldh1a2 in WT fish at 7 d post sham operation, and WT and angpt4 mutant at 7 dpi. Representative images of three replicates are shown. Scale bar, 100 μm. (K) qRT-PCR results showing expression levels of aldh1a2 in WT fish at 7 days post sham operation, and WT, angpt4 mutant, and MAPK signaling inhibitor AZD6244 treated WT zebrafish at 7 dpi. Two-tailed Student’s t-test, **P < 0.01, ***P < 0.001. n = 3 for each group. Error bar represents standard deviation. (L) Immunofluorescence staining results showing BrdU signals near the injury site in adult zebrafish heart cryosections from WT, angpt4 mutant, Tie2 inhibitor treated WT, and bpV treated angpt4 mutant at 14 dpi. Red, Mef2c; Green, BrdU. Scale bar, 50 μm. (M) Statistical analysis results of BrdU positive cardiomyocytes in (L). Two-tailed Student’s t-test, **P < 0.01. n = 3–4 for each group. Error bar represents standard deviation. |

ANGPT4 promotes cardiac repair in vitro and in vivo. (A) Experimental design to evaluate heart regeneration potential in angpt4 overexpressing zebrafish. (B) Masson’s trichrome staining results of adult zebrafish heart sections from wildtype (WT) and Tg(cmlc2:EGFP-angpt4) (OE) at 30 dpi. Red, muscle cells stained with acid fuchsin; blue, collagen stained with aniline blue. Scale bar, 100 μm. (C) Statistical analysis results of scar size in 30 dpi of WT and Tg(cmlc2:EGFP-angpt4) (OE) hearts. Two-tailed Student’s t-test, **P < 0.01. n = 9 for each group. Error bar represents standard deviation. (D) Experimental design for treatment with different doses of recombinant ANGPT4 protein and studying its effect on the expression of cell cycle markers in NRCM. (E and F) Immunofluorescence staining results showing Ki67 (E) and Aurora B (F) signals in NRCM following treatment with 0.75 μg/mL recombinant human ANGPT4 protein. Scale bar, 25 μm. (G and H) Statistical analysis of Ki67 and Aurora B positive NRCM in (E and F). Two-tailed Student’s t-test, *P < 0.05; ***P < 0.001. n = 3–5 for each group. Error bar represents standard deviation. (I) Western blot of pERK in cultured primary neonatal rat cardiac cells with or without 0.75 μg/mL ANGPT4 protein treatment. (J) Statistical analysis of (I) showing pERK signals were significantly increased in 0.75 μg/mL ANGPT4 treated cardiac cells. Vertical axis shows the pERK-to-Histone H3 ratio, normalized to the control group. Student’s t-test, *P < 0.05. n = 3 for each group. Error bar represents standard deviation. (K) Experimental timeline for evaluation of cardiomyocyte proliferation and cardiac function after MI in mice injected with AAV9-GFP and AAV9-ANGPT4. (L) Western blot analysis showing the expression of GFP or ANGPT4 3 weeks after intravenous AAV9-GFP or AAV9-ANGPT4 injection. (M) Western blot analysis showing the activation of pERK at 2 weeks post MI in AAV9-ANGPT4 injected mouse hearts. (N) Statistical analysis of (M), showing pERK signals were significantly increased in AAV9-ANGPT4 injected mice relative to AAV9-GFP injected mice. Vertical axis shows the pERK-to-Histone H3 ratios, normalized to the control group. Student’s t-test, *P < 0.05. n = 3 for each group. Error bar represents standard deviation. (O) Immunofluorescence staining showing Ki67 and Aurora B signals at 2 weeks post MI in cardiomyocytes of AAV9-GFP and AAV9-ANGPT4 injected mice. Scale bar, 100 μm. (P and Q) Statistical analysis of Ki67 and Aurora B positive cardiomyocyte in (M). Two-tailed Student’s t-test, *P < 0.05; ***P < 0.001. n = 5 for each group. Error bar represents standard deviation. (R and S) Statistical analysis showing differences of cardiac function indexed by EF (%) and FS (%) measured by echocardiography between 2 weeks and 6 weeks post MI. Two-tailed Student’s t-test, *P < 0.05. n = 7–8 for each group. Error bar represents standard deviation. (T) Model depicting an Angpt4-mediated cellular coordination network among major cardiac cell types during zebrafish heart regeneration. Angpt4 is specifically activated and required for heart regeneration in both zebrafish and mammals. This model illustrates the underlying molecular and cellular mechanisms, where Angpt4 initiates a cellular coordination cascade along an EPDC (RIC)-EC-CM axis by activating MAPK-RA signaling pathways during heart regeneration. |