
Figure 5.
- ID
- ZDB-FIG-230511-11
- Publication
- Wu et al., 2023 - Single-cell analysis reveals an Angpt4-initiated EPDC-EC-CM cellular coordination cascade during heart regeneration
- Other Figures
- All Figure Page
- Back to All Figure Page
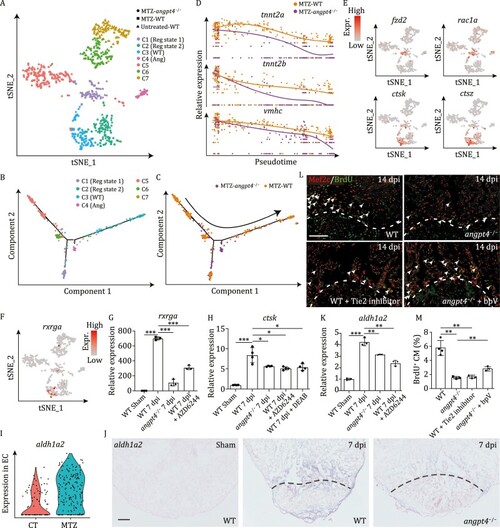
Single cell transcriptome analysis of ventricular cardiomyocytes from angpt4 mutant embryos during heart regeneration. (A) t-SNE analysis showing heterogeneity of CM-V from untreated and MTZ-treated wildtype (WT) embryos as well as MTZ-treated angpt4 mutant embryos. Cells are colored by clusters and shaped by sample conditions. Reg state, regeneration state; WT, WT specific population; Ang, angpt4 mutant specific population. (B and C) Pseudotime analysis using MTZ-treated wildtype (WT) and angpt4 mutant CM-V, colored by the clusters identified in panel A (B) and genotype (C), respectively. Arrow indicates the order of pseudotime. (D) The expression pattern of tnnt2a, tnnt2b, and vmhc following pseudotime in MTZ-treated wildtype (WT) embryos and angpt4 mutants. The expression pattern of WT and angpt4 mutants were fitted by Monocle2. (E) t-SNE maps derived from scRNA-seq data of ventricular cardiomyocytes from WT and angpt4 mutant embryos based on Fig. 5A, showing expression patterns of fzd2, rac1a, ctsk, and ctsz. (F) t-SNE maps derived from scRNA-seq data of ventricular cardiomyocytes from WT and angpt4 mutant embryos based on Fig. 5A, showing expression pattern of rxrga. (G) qRT-PCR results showing expression levels of rxrga in WT fish at 7 days post sham operation, and WT, angpt4 mutant, and MAPK signaling inhibitor AZD6244 treated WT zebrafish at 7 dpi. Two-tailed Student’s t-test, ***P < 0.001. n = 3 for each group. Error bar represents standard deviation. (H) qRT-PCR results showing ctsk expression level in WT fish at 7 days post sham operation, and WT, angpt4 mutant, MAPK signaling inhibitor AZD6244 treated WT, and RA signaling inhibitor DEAB treated WT zebrafish at 7 dpi. Two-tailed Student’s t-test, *P < 0.05, ***P < 0.001. n = 4 for each group. Error bar represents standard deviation. (I) Violin plot showing aldh1a2 was up-regulated in EC after MTZ treatment. (J) In situ hybridization results showing expression pattern of aldh1a2 in WT fish at 7 d post sham operation, and WT and angpt4 mutant at 7 dpi. Representative images of three replicates are shown. Scale bar, 100 μm. (K) qRT-PCR results showing expression levels of aldh1a2 in WT fish at 7 days post sham operation, and WT, angpt4 mutant, and MAPK signaling inhibitor AZD6244 treated WT zebrafish at 7 dpi. Two-tailed Student’s t-test, **P < 0.01, ***P < 0.001. n = 3 for each group. Error bar represents standard deviation. (L) Immunofluorescence staining results showing BrdU signals near the injury site in adult zebrafish heart cryosections from WT, angpt4 mutant, Tie2 inhibitor treated WT, and bpV treated angpt4 mutant at 14 dpi. Red, Mef2c; Green, BrdU. Scale bar, 50 μm. (M) Statistical analysis results of BrdU positive cardiomyocytes in (L). Two-tailed Student’s t-test, **P < 0.01. n = 3–4 for each group. Error bar represents standard deviation. |