
|
Figure 4.
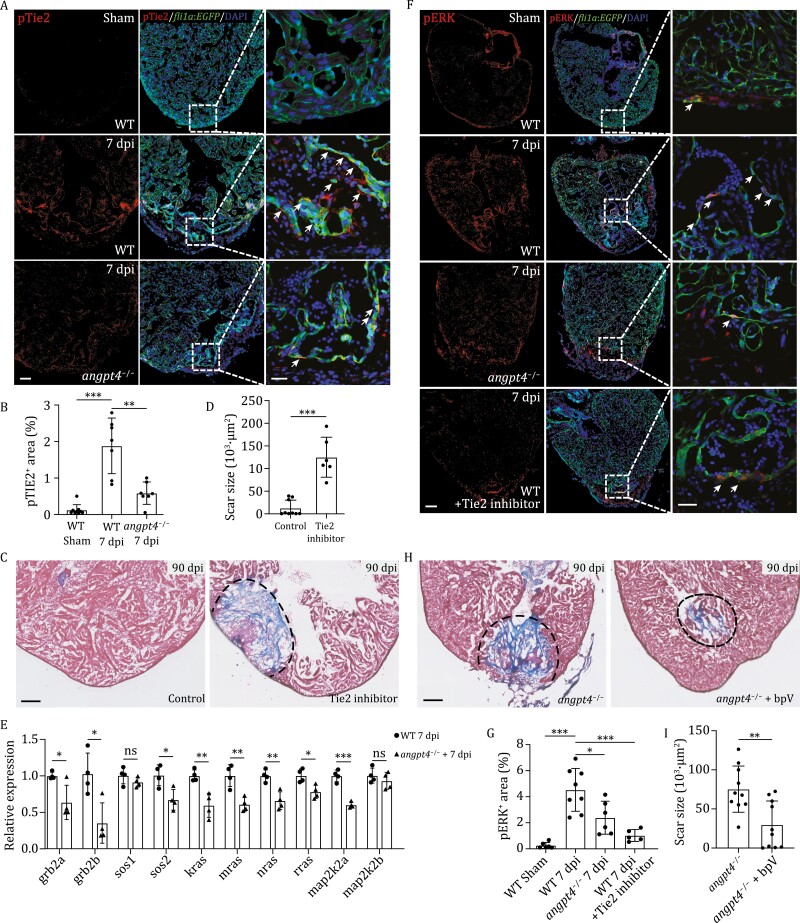
Angpt4 regulates heart regeneration by activating endocardial Tie2-MAPK signaling pathway. (A) Immunofluorescence staining results showing the pTie2 (Tyr992) signal in heart sections from WT at 7 days post sham operation, and WT and angpt4 mutant at 7 dpi. Scale bar, 100 μm. Right panels showed higher magnification views of the rectangle region. Arrows indicate pTie2-positive EC. Representative images of three independent replicates are shown. Red, pTie2; Green, EGFP, representing EC. Scale bar, 25 μm. (B) Statistical analysis results of relative pTie2 signals in 7 dpi of WT and angpt4−/− hearts. Two-tailed Student’s t-test, **P < 0.01, ***P < 0.001. n = 7 for each group. Error bar represents standard deviation. (C) Masson’s trichrome staining results of adult zebrafish heart cryosections from WT and Tie2 inhibitor treated WT fish at 90 dpi. Red, muscle cells stained with acid fuchsin; blue, collagen stained with aniline blue. Scale bar, 100 μm. (D) Statistical analysis results of scar size in 90 dpi WT and Tie2 inhibitor treated WT fish. Two-tailed Student’s t-test, ***P < 0.001. n = 6–10 for each group. Error bar represents standard deviation. (E) qRT-PCR results showing expression level of several components of the MAPK signaling pathway in 7 dpi WT or angpt4 mutant zebrafish hearts. Two-tailed Student’s t-test, ns, not significant, *P < 0.05, **P < 0.01, ***P < 0.001. n = 4 for each group. Error bar represents standard deviation. (F) Immunofluorescence staining of pERK in WT fish at 7 d post sham operation, and WT, angpt4 mutant, and Tie2 inhibitor treated WT heart sections at 7 dpi under Tg (fli1a:EGFP) transgenic background. Scale bar, 100 μm. Right panels show higher magnification views of the rectangular region. Arrows indicate pERK signals in EGFP-positive cells. Representative images of three independent replicates are shown. Red, pERK; Green, EGFP, representing EC. Scale bar, 25 μm. (G) Statistical analysis results of relative pERK signals in WT fish at 7 days post sham operation, and WT, angpt4 mutant, and Tie2 inhibitor treated WT fish at 7 dpi. Two-tailed Student’s t-test, *P < 0.05, ***P < 0.001. n = 6–8 for each group. Error bar represents standard deviation. (H) Masson’s trichrome staining results of adult zebrafish heart cryosections from angpt4 mutants and bpV treated angpt4 mutants at 90 dpi. Red, muscle cells stained with acid fuchsin; blue, collagen stained with aniline blue. Scale bar, 100 μm. (I) Statistical analysis results of scar size at 90 dpi in angpt4 mutants and bpV treated angpt4 mutants. Two-tailed Student’s t-test, **P < 0.01. n = 10 for each group. Error bar represents standard deviation.