
- Title
-
Disruption of T-box transcription factor eomesa results in abnormal development of median fins in Oujiang color common carp Cyprinus carpio
- Authors
- Song, S., Du, B., Chung-Davidson, Y.W., Cui, W., Li, Y., Chen, H., Huang, R., Li, W., Li, F., Wang, C., Ren, J.
- Source
- Full text @ PLoS One
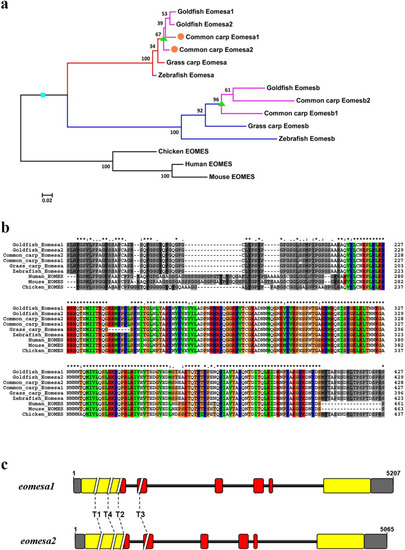
(a) The phylogenetic tree was constructed using the ML method with 1,000 bootstraps. The cyan square represents teleost-specific whole genome duplication (TS-WGD, or 3R-WGD) and green triangles represent the fourth-round whole genome duplication (4R-WGD) occurred before the speciation of the common ancestor of common carp and goldfish. (b) Dashes are introduced to improve the alignment. The T-box domain is marked by colored boxes. (c) The gray boxes indicate untranslated regions. Yellow boxes indicate exons, and red boxes indicate exons encoding the T-box domain. The dash lines indicate the target sites. |
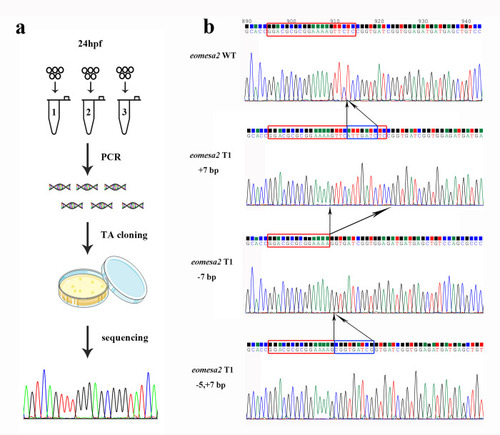
(a) The procedure of gene editing efficiency measurement on 24 hpf embryo. (b) The sequencing chromatographs of TA cloning results show the representatives of three types of mutations including insertion (+7 bp), deletion (-7 bp) and both (-5,+7 bp) around T1 of eomesa1 locus. The red rectangles indicate the target bases, and the blue rectangles indicate the inserted bases. |
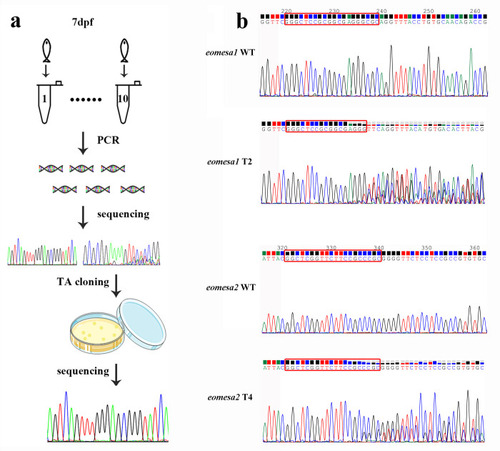
(a) The measurement procedure of gene editing efficiency includes population editing efficiency (Ep) and individual editing efficiency (Ei) on 7 dpf larvae. (b) Sanger sequencing chromatographs show overlapped peaks in the eomesa1 T2 and eomesa2 T4 sites in targeted individuals, and the ratio of peak heights from these overlapped peaks between WT and mutants implies the knockout efficiency. The red rectangles indicate the target bases. |
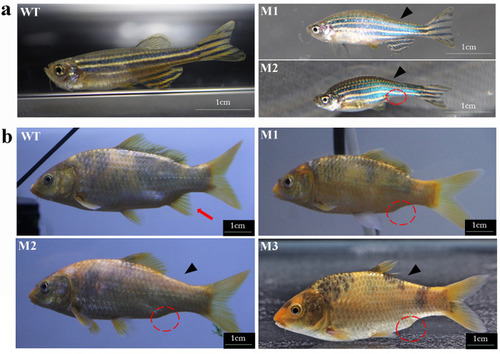
(a) Lateral view of wild type and eomesa mutant zebrafish. Compared to the wild type, the eomesafh105 mutants exhibit two phenotypes. All mutants exhibit the phenotype with no dorsal fin. Rare mutants exhibit the phenotype with no dorsal fin and anal fin. (b) Lateral view of four-month-old wild type and eomesa mosaic mutants of color common carp. Compared to the wild type, three mosaic mutants (M1-M3) exhibit different degrees of deformity in the dorsal fins and complete loss of anal fins. PHENOTYPE:
|