
Image
|
Figure Caption
Fig 3
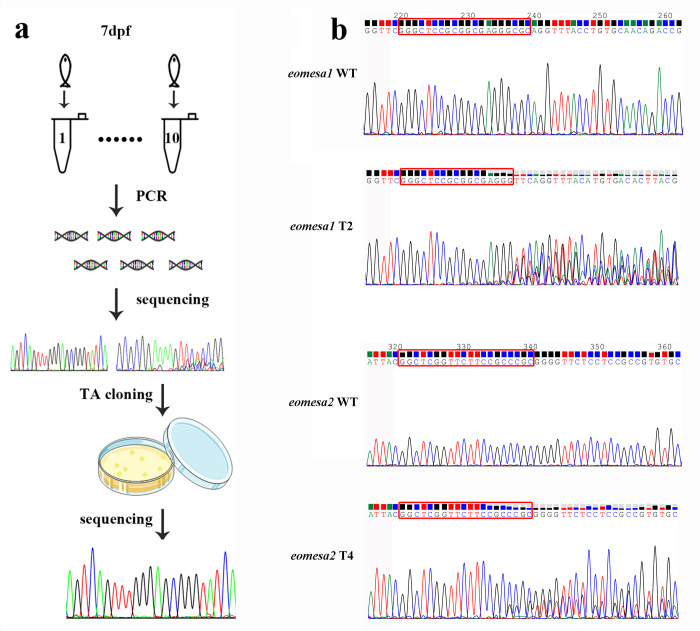
(a) The measurement procedure of gene editing efficiency includes population editing efficiency (Ep) and individual editing efficiency (Ei) on 7 dpf larvae. (b) Sanger sequencing chromatographs show overlapped peaks in the eomesa1 T2 and eomesa2 T4 sites in targeted individuals, and the ratio of peak heights from these overlapped peaks between WT and mutants implies the knockout efficiency. The red rectangles indicate the target bases.
Acknowledgments
This image is the copyrighted work of the attributed author or publisher, and
ZFIN has permission only to display this image to its users.
Additional permissions should be obtained from the applicable author or publisher of the image.
Full text @ PLoS One