
- Title
-
Loss of calpain3b in Zebrafish, a Model of Limb-Girdle Muscular Dystrophy, Increases Susceptibility to Muscle Defects Due to Elevated Muscle Activity
- Authors
- Prykhozhij, S.V., Caceres, L., Ban, K., Cordeiro-Santanach, A., Nagaraju, K., Hoffman, E.P., Berman, J.N.
- Source
- Full text @ Genes (Basel)
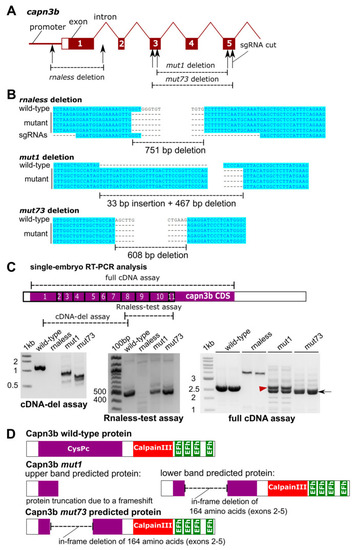
Generation and molecular characterization of the capn3b mutants. (A) Structure of the capn3b gene, including the promoter region, the first 5 exons, and introns. The targeted regions are shown where deletions were generated by the indicated sgRNAs. (B) Genomic sequencing of the deletion alleles and their alignment to the wild-type sequence. (C) Reverse transcription polymerase chain reaction (RT-PCR) analysis of capn3b transcripts in single-embryo cDNA samples of indicated genotypes. The regions of the capn3b mRNA analyzed by these assays are indicated in the diagram. Exon numbers are in the boxes. The bands in the mut1 and mut73 RT-PCR are indicated with a red arrowhead (upper band) and a black arrow (lower band). (D) Sequencing of the RT-PCR products of the full cDNA assay allowed protein-level interpretation of the identified mutations, as illustrated using protein domain diagrams. |
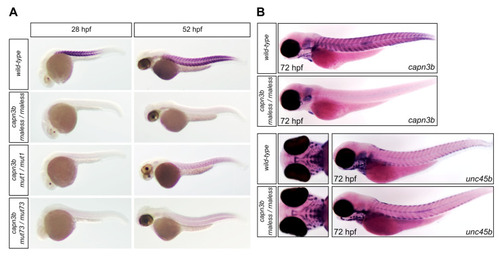
Expression pattern analysis of capn3b in wild-type and capn3b mutant zebrafish embryos. (A) Whole mount in situ hybridization with the capn3b probe, not including the deleted regions, was performed in wild-type, capn3b mut1/mut1, capn3b mut73/mut73, and capn3b rnaless/rnaless embryos at 28 and 52 hpf. (B) Whole mount in situ hybridization analysis with the capn3b and unc45b probes in wild-type and capn3b rnaless/rnaless embryos at 72 hpf. For each sample type, at least 40 embryos were stained. Representative images are shown in the figure (hpf = hours post-fertilization). EXPRESSION / LABELING:
PHENOTYPE:
|

Generation and the phenotype of the zebrafish dmd mutant. (A) Structure of the targeted region of the dmd gene, including exons 24 and 25. The sgRNA cut positions are indicated. (B) Genomic sequencing of the deletion alleles and their alignment to the wild-type sequence. (C) RT-PCR analysis of the targeted dmd region. The dmd deletion assay region is indicated in the diagram. Results of dmd cDNA deletion assay in single embryo samples of the indicated genotypes are shown. The dmd cDNA deletion assay wild-type band is indicated with a red arrowhead and the mutant band is indicated with a black arrow. (D) cDNA deletion PCR product sequencing analysis shows the resulting 155-bp deletion at the cDNA-level. (E) Sequencing of the RT-PCR products of the dmd cDNA deletion assay allowed protein-level interpretation of the identified mutation, as illustrated using protein domain diagrams. (F) Birefringence analysis of dmd+/− incross embryos shows approximately 25% of dmd−/− embryos with disrupted muscle structure, whereas siblings show a normal birefringence pattern. |
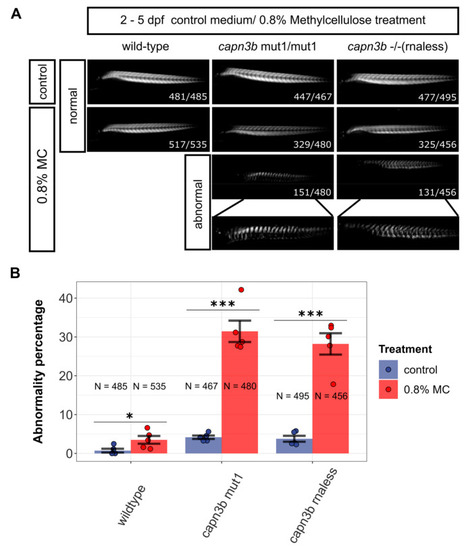
Mutants in capn3b gene are significantly more sensitive than wild-type zebrafish to growth in methylcellulose. (A) Birefringence imaging of wild-type, capn3bmut1/mut1, and capn3b−/− (rnaless) mutant embryos after culturing them from 2 days post fertilization (dpf) to 5 dpf under control conditions or in 0.8% methylcellulose (MC) in E3 medium. Photographs of embryos with normal muscle morphology or disrupted (abnormal) are shown, except for wild-type embryos, which were almost completely resistant to the treatment. The combined numbers out of the total analyzed are shown at the lower right-hand corner of the representative images. (B) Plot of the percentages of embryos with abnormal muscle structure (abnormality percentage) for embryos of different genotypes. Significance is calculated using the Cochran–Mantel–Haenszel test using all available counts in 3-dimensional contingency tables. “***” indicates p-values < 0.001 and ‘*’—p-value < 0.05. PHENOTYPE:
|
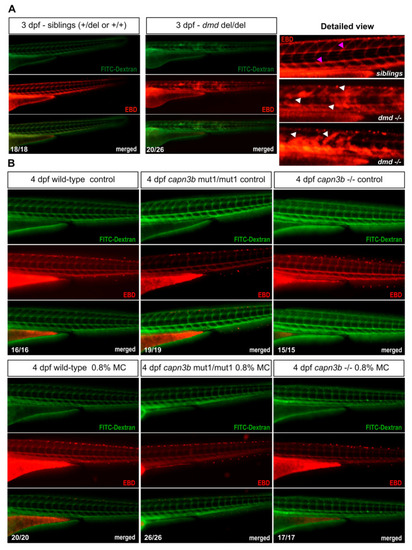
Evans Blue Dye analysis shows lack of permeability disruption by methylcellulose incubation in both wild-type and capn3b mutant embryos. (A) Evans Blue Dye (EBD) and FITC-Dextran injected sibling and dmd−/− embryos at 3 dpf. EBD signal is labeled in red and FITC-dextran in green. Merged images suggest a near complete co-localization of EBD and FITC-dextran. Vascular labeling indicates the normal situation where muscle permeability is not disrupted, whereas the more widespread labeling indicates disruption of muscle cell permeability. The detailed magnified view shows examples of sibling and dmd−/− embryo EBD labeling. White arrowheads show damaged muscle labeling and fuchsia arrowheads label EBD in the blood vessels in the sibling embryos. (B) EBD assay of wild-type, capn3bmut1/mut1, and capn3b−/− mutant embryos after culturing them from 2 days post-fertilization (dpf) to 4 dpf under control conditions or in 0.8% methylcellulose (MC) in E3 medium. Only vascular labeling could be detected in all of the imaged embryos. The combined numbers out of the total analyzed are shown in the bottom right-hand corner of the representative images. PHENOTYPE:
|

Elevated sensitivity of capn3b−/− (rnaless) mutant to cholinesterase inhibitor treatment. (A) Birefringence analysis of wild-type and capn3b−/− (rnaless) mutant embryos after the control treatment or with increasing concentrations (0.3, 0.5, and 0.75 µM) of azinphos-methyl (APM). Images of embryos with normal and abnormal tail musculature for each genotype. The combined numbers out of the total analyzed are shown in the lower right-hand corner of the representative images. (B) Plot of the percentages of embryos of different genotypes with abnormal muscle structure (abnormality percentage) for different treatments. Significance is calculated using the Cochran–Mantel–Haenszel test using all available counts in three-dimensional contingency tables. “***” indicates p-values < 0.001. (C) Whole mount in situ hybridization for hspb11 muscle activity marker in control and 0.3 µM APM-treated wild-type and capn3b−/− (rnaless) mutant embryos from 2 to 3 dpf. Groups of 40 embryos were treated and analyzed, resulting in near-uniform labeling patterns shown in representative images (dpf = days post-fertilization). EXPRESSION / LABELING:
PHENOTYPE:
|