
|
Figure 3
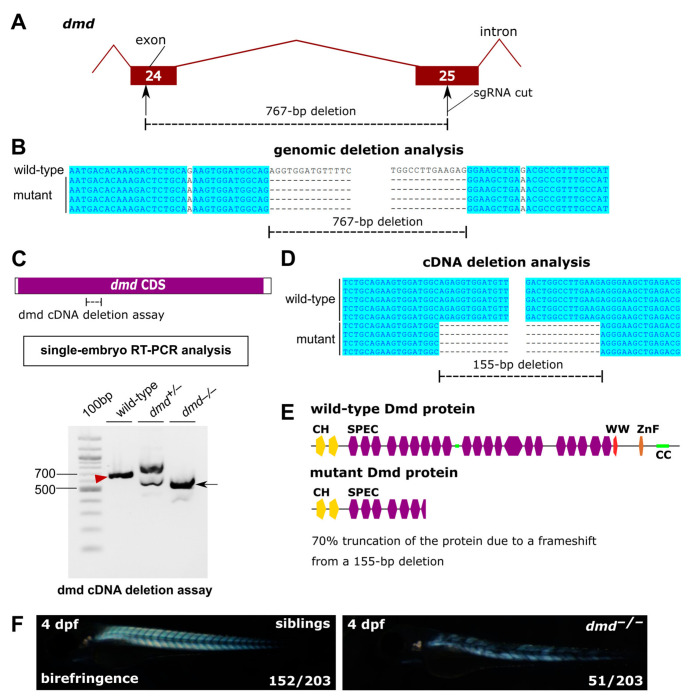
Generation and the phenotype of the zebrafish dmd mutant. (A) Structure of the targeted region of the dmd gene, including exons 24 and 25. The sgRNA cut positions are indicated. (B) Genomic sequencing of the deletion alleles and their alignment to the wild-type sequence. (C) RT-PCR analysis of the targeted dmd region. The dmd deletion assay region is indicated in the diagram. Results of dmd cDNA deletion assay in single embryo samples of the indicated genotypes are shown. The dmd cDNA deletion assay wild-type band is indicated with a red arrowhead and the mutant band is indicated with a black arrow. (D) cDNA deletion PCR product sequencing analysis shows the resulting 155-bp deletion at the cDNA-level. (E) Sequencing of the RT-PCR products of the dmd cDNA deletion assay allowed protein-level interpretation of the identified mutation, as illustrated using protein domain diagrams. (F) Birefringence analysis of dmd+/− incross embryos shows approximately 25% of dmd−/− embryos with disrupted muscle structure, whereas siblings show a normal birefringence pattern.