
- Title
-
The isl2a transcription factor regulates pituitary development in zebrafish
- Authors
- Yan, C.Y., Wu, F.Y., Sun, F., Fang, Y., Zhang, R.J., Zhang, C.R., Zhang, C.X., Wang, Z., Yang, R.M., Yang, L., Dong, M., Zhang, Q.Y., Ye, X.P., Song, H.D., Zhao, S.X.
- Source
- Full text @ Front Endocrinol (Lausanne)

Generation of isl2a and isl2b knockout zebrafish utilizing CRISPR-Cas9 technology. (A) Amino acid identity between zebrafish and human ISL2 proteins was performed using UCSC Blat software. (B) The isl2a-CRISPR-target site (black bold words) was designed in exon3 of isl2a and the CRISPR/Cas9-induced insertion of 13 nucleotides (red words) was selected for further investigation. (C) In the case of isl2b, the CRISPR-target site (bold words) was designed in exon2, and the induced deletion of five nucleotides (red words) was selected for further investigation. Genotypes, including wild-type and homozygotes, were analyzed and shown in the bottom panel. Both genotypes were predicted to produce truncated proteins. |

Effect of isl2a knockout on the expression of genes involved in pituitary development via whole-mount in situ hybridization. (A) Spatiotemporal expression patterns of isl2a by whole-mount RNA in situ hybridization at 24 and 48 hpf. Scale bars = 100 µm/50 µm. Asterisks (*) indicate the position of midbrain-hindbrain boundary. p, pineal gland; r, retinal; ov, otic vesicle; d, diencephalon. (B) Knockout of isl2a resulted in reduced tshba and cga expression, while the expression of pomca, prl, and gh was not changed in larvae at 3 dpf. Pituitary precursors differentiate into specific cell types with markers, including gh (for somatotropes), tshba (for thyrotropes), cga (for thyrotropes and gonadotropes), prl (for lactotropes), and pomca (for corticotropes and melanotropes). All images are dorsal views with the head pointing towards the left. Scale bar = 50 µm. Numbers indicate the ratio of embryos with the shown phenotype. (C) qRT-PCR analysis demonstrates the expression of total tg, tshba and cga in isl2a+/+, isl2a+/− and isl2a−/− larvae at 3 dpf. Data is represented as mean ± SD (n = 5, 15 fish per tube). *P<0.05, **P<0.01, ****P<0.001. (D) Ventral views of embryos at 24 hpf show no differences in shha, pitx3, lhx3 and lhx4 expression in isl2a mutants. Dorsal views of embryos at 48 hpf show no difference in gene expression, indicating specification of pit-1 lineage (pit1, for somatotropes, thyrotropes, and lactotropes) or non-pit-1 lineage (six1b for corticotropes, gonadotropes, and melanotropes). Thus, pituitary induction and lineage specification were unaffected in isl2a mutants. Scale bar = 100 µm. The black triangle indicates gene expression in the adenohypophyseal placode. |
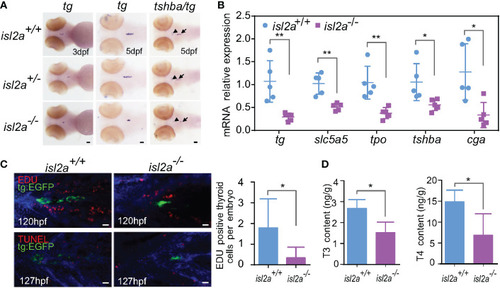
Isl2a mutants show reduced thyroid function. (A) The assessment of tg expression in isl2a mutants at 3 dpf and 5 dpf via whole-mount in situ hybridization. At 5 dpf, isl2a-/- zebrafish had lower expression of tg and tshba as denoted by black arrows and arrowhead, respectively. Scale bar = 50 µm. (B) qRT-PCR analysis of the total expression of tg, slc5a5, tpo, tshba, and cga in isl2a+/+ and isl2a-/- larvae at 5 dpf. Error bars represent ± SD (n = 5, 15 fish per tube). (C) Both EGFP (green) and EdU immunoreactivity (red) were present in the thyroid of 120 hpf Tg (tg:egfp) wild-type (n = 7) larvae, whereas nearly no EdU-positive cells were detected within the tg domain in isl2a-/- larvae (n = 6). There were also no TUNEL-positive cells (red) in the tg domain at 127 hpf. Scale bar = 500 µm. (D) Thyroxine (T4) and 3,5,3′-triiodothyronine (T3) levels in the zebrafish body at 44 dpf. Error bars represent ± SD (n = 4). Asterisks indicate significant differences between isl2a+/+ and isl2a-/- groups (*P < 0.05, **P < 0.01). |

Growth retardation in isl2a knockout zebrafish. (A) The Kaplan-Meier survival curve of isl2a+/+ (n = 159), isl2a+/− (n = 173), and isl2a−/− (n = 253) larvae shows differences. (B) Male/female ratios in isl2a+/+ (male/female = 20/6), isl2a+/− (male/female = 42/10), and isl2a−/− (male/female = 18/3). (C) The isl2a variant caused significant growth defects in 41 dpf zebrafish adults. Scale bar = 1 mm. (D) Comparison of developmental indicators, including body length, heart rate, eye size, and ear size, among isl2a-/-, isl2a+/+ and isl2a+/- siblings at 5 dpf. (E) Comparison of three diameter lines of skull among different groups at 5 dpf. (F) Dynamic tracking of the body length of isl2a-/- individuals and their isl2a+/+ and isl2a+/- siblings at 14 dpf, 41 dpf, 77 dpf, and 7.5 mpf. *P<0.05, **P<0.01, ***P<0.001, ****P<0.0001. |