
- Title
-
Morroniside ameliorates glucocorticoid-induced osteoporosis and promotes osteoblastogenesis by interacting with sodium-glucose cotransporter 2
- Authors
- Yang, H.Z., Dong, R., Jia, Y., Li, Y., Luo, G., Li, T., Long, Y., Liang, S., Li, S., Jin, X., Sun, T.
- Source
- Full text @ Pharm Biol
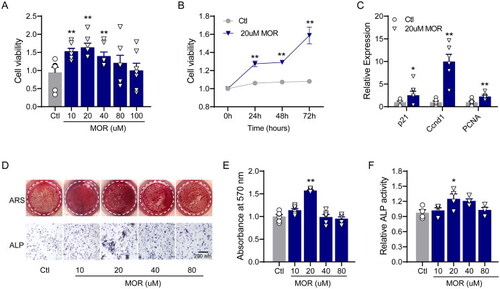
Morroniside promotes the proliferation and differentiation of MC3T3-E1 cells. (A) Cell viability was measured after treatment with different concentrations of morroniside (10, 20, 40 and 80 μM). (B) After 20 μM of MOR treatment, cell viability was monitored over 72 h, and a time-dependent increase in cell viability was observed. (C) The expression of p21, Ccnd1 and PCNA was determined by RT-PCR. (D) The effects of MOR on MC3T3-E1 cell differentiation and alkaline phosphatase (ALP) activity as shown by alizarin red staining (ARS) and ALP staining. Quantitative analysis of ARS (E) and ALP stating (F). *p< 0.05, **p< 0.01 vs. Ctl. n = 4–6. |
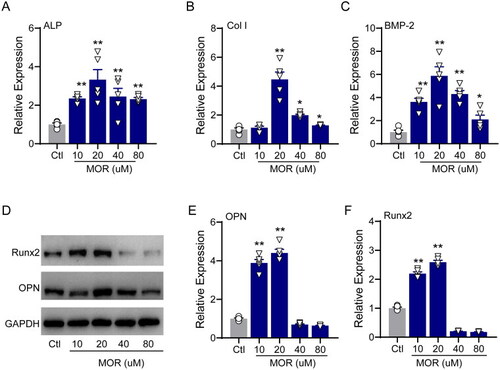
RT-PCR quantification of the osteogenic differentiation marker genes ALP (A), Col I (B) and BMP2 (C) in the control and MOR treatment groups. (D) Runx2, OPN and GAPDH protein levels were detected by Western blotting in MC3T3-E1 cells. NOR (10 and 20 μM) significantly increased OPN (E) and Runx2 (F) protein levels. *p< 0.05, **p< 0.01 vs. Ctl. n = 6. |
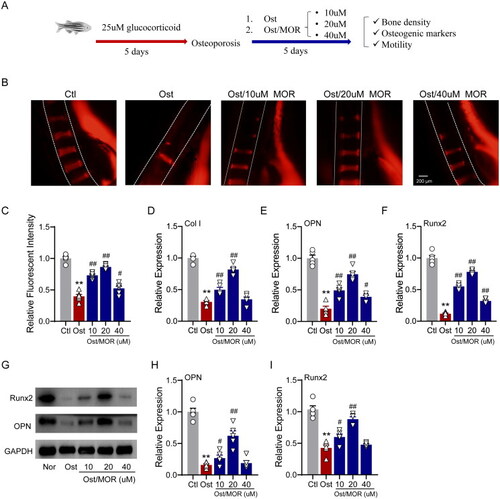
Morroniside ameliorates glucocorticoid-induced OP in a zebrafish model. (A) Schematic illustration of the experimental design for the MOR in vivo study in a zebrafish OP model. (B) Representative fluorescence images of normal and MOR-treated zebrafish. (C) Quantification of the fluorescence intensity of the spinal cord column. RT-PCR quantification of osteogenic differentiation marker genes Col I (D), OPN (E) and Runx2 (F) in the normal (Nor), OP (Ost) and MOR treatment groups. (G) Runx2, OPN and GAPDH protein levels were detected by Western blotting in zebrafish. MOR treatments significantly increased the OP-associated decline in OPN (I) and Runx2 (J) protein levels. **p< 0.01 vs. Ctl; #p< 0.05, ##p< 0.01 vs. Ost. n = 6. |
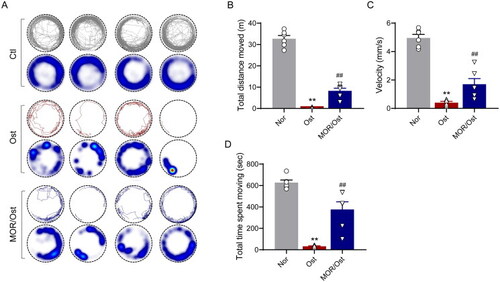
Morroniside ameliorates mobility impairment in OP zebrafish. (A) The locomotive trajectory of normal (Nor), OP (Ost) and MOR-treated zebrafish in 20 min. The lines indicate zebrafish locomotive trajectories. Heatmap colours indicate the duration of time the zebrafish spent in each location over 10 min. MOR treatment significantly increased the total distance moved (B), velocity (C) and total time spent moving (D) in OP zebrafish. **p< 0.01 vs. Ctl; ##p< 0.01 vs. Ost. n = 6. |
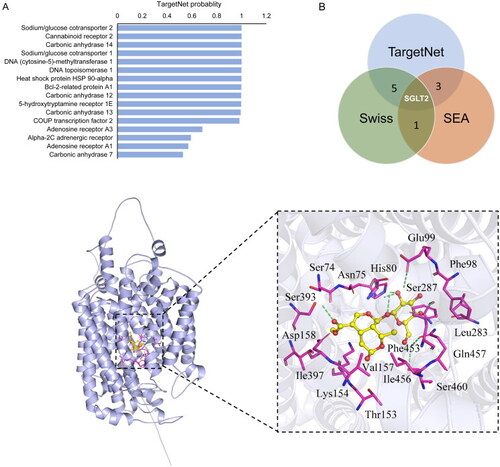
Target prediction and molecular docking of morroniside. (A) The top-ranking interacting protein for MORs from the TargetNet server. (B) Venn graph showing the numbers of overlapping targets predicted from TargetNet, SwissTarget and SEA. (C) Molecular docking of MOR in the glucose pocket of SGLT2. (D) Closer view of the binding pocket. Green dashed lines: residues involved in the interactions. Cyan sticks: Rg5; yellow dashed lines: hydrogen bonds; magenta sphere: catalytic zinc ion. |

SLC5A2 inhibitor attenuates the effects of morroniside on OP zebrafish. Representative fluorescence images of normal and MOR-treated zebrafish. (A) Representative fluorescence images of the normal (Nor), OP (Ost), EMP, MOR and MOR + EMP treatment groups. (B) The locomotive trajectory of all groups in 20 min. (C) Quantification of the fluorescence intensity of the spinal cord column. Quantification of the total distance moved (D) and total time spent moving (E) in all groups. **p< 0.01 vs. Ctl; #p< 0.05, ##p< 0.01 vs. Ost; ^^p< 0.01 vs. MOR. n = 6. |

SLC5A2 inhibitor attenuates the effects of morroniside on osteoblastogenesis markers in zebrafish. RT-PCR quantification of osteogenic differentiation marker genes OSX (A), Col I (B) and Runx2 (C) in all groups. (D) Runx2, OPN and GAPDH protein levels were detected by Western blotting in zebrafish. Western blotting quantification of OPN (E) and Runx2 (F). **p< 0.01 vs. Ctl; #p< 0.05, ##p< 0.01 vs. Ost; ^^p< 0.01 vs. MOR. n = 6. |

SLC5A2 inhibitor attenuates the effects of morroniside on osteoblastogenesis markers in MC3T3-E1 cells. RT-PCR quantification of osteogenic differentiation marker genes Runx2 (A), OSX (B) and Col I (C) in all groups. (D) Runx2, BMP-2 and GAPDH protein levels were detected by Western blotting in MC3T3-E1 cells. Western blotting quantification of BMP-2 (E) and Runx2 (F). *p< 0.05, **p< 0.01 vs. Ctl; ##p< 0.01 vs. MOR. n = 6. |