
Image
|
Figure Caption
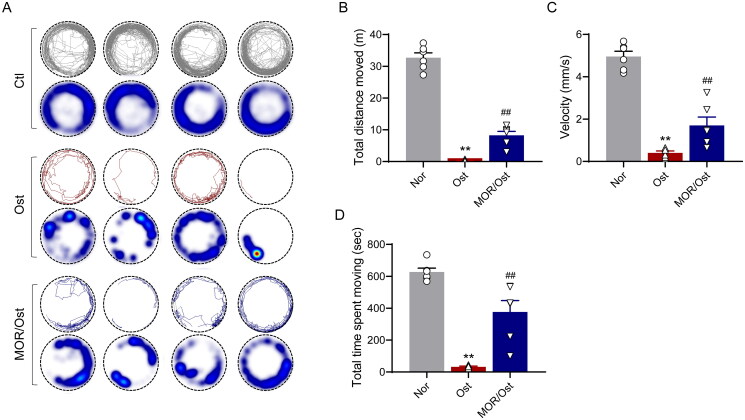
Figure 4.
Morroniside ameliorates mobility impairment in OP zebrafish. (A) The locomotive trajectory of normal (Nor), OP (Ost) and MOR-treated zebrafish in 20 min. The lines indicate zebrafish locomotive trajectories. Heatmap colours indicate the duration of time the zebrafish spent in each location over 10 min. MOR treatment significantly increased the total distance moved (B), velocity (C) and total time spent moving (D) in OP zebrafish. **p< 0.01 vs. Ctl; ##p< 0.01 vs. Ost. n = 6.
Acknowledgments
This image is the copyrighted work of the attributed author or publisher, and
ZFIN has permission only to display this image to its users.
Additional permissions should be obtained from the applicable author or publisher of the image.
Full text @ Pharm Biol