
- Title
-
Zebrafish her3 knockout impacts developmental and cancer-related gene signatures
- Authors
- Kent, M.R., Calderon, D., Silvius, K.M., Kucinski, J.P., LaVigne, C.A., Cannon, M.V., Kendall, G.C.
- Source
- Full text @ Dev. Biol.
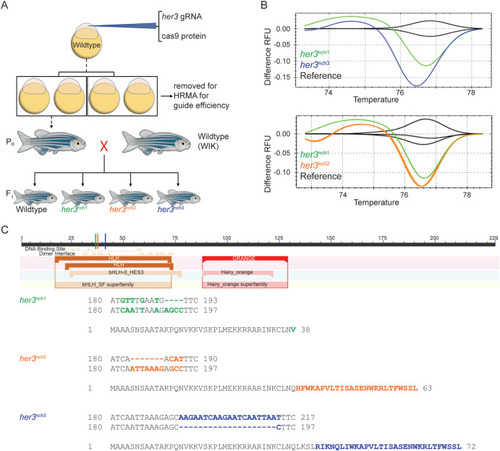
Fig. 1. Generating her3 mutations in zebrafish. (A) Schematic of strategy to generate a her3 CRISPR/Cas9 null mutant zebrafish. Zebrafish embryos were injected in the cytoplasm at the 1-cell stage with both Cas9 protein and her3 gRNA. A subset of the injected clutch was set aside to determine gRNA efficiency. The remaining embryos were grown up to identify adult founders, which were outcrossed to wildtype WIK zebrafish to generate the F1 generation. (B) HRMA difference RFU graphs of F1 heterozygous zebrafish generated from three identified founders. Fin clips of adult F1 zebrafish were taken and HRMA was performed to identify potential mutations, with different melt curves indicating distinct DNA mutations. Wildtype reference fish are labeled black, her3nch1 fish are labeled green, her3nch2 fish are labeled orange, and her3nch3 fish are labeled blue. Each line represents an individual fish. (C) Schematic of full length Her3 protein and identified mutation sequences. To determine the mutation sequence, the her3 gRNA target site from the three prospective mutant F1 fish was A-tail cloned into the pGEM T-Easy vector. Multiple colonies from each line were Sanger sequenced with an SP6 primer. The mutated sequence was then aligned with the wildtype reference sequence for her3. Colored lines in the schematic indicate where the predicted frameshift mutation occurs for each respective mutation, all of which are in the DNA binding domain. Below, the DNA sequence and amino acid sequence are shown for the three mutations, with mutant DNA sequence on top of the aligned wildtype sequence. For both the DNA sequence and the amino acid sequence, colored and bolded letters highlight the mutated sequence. |
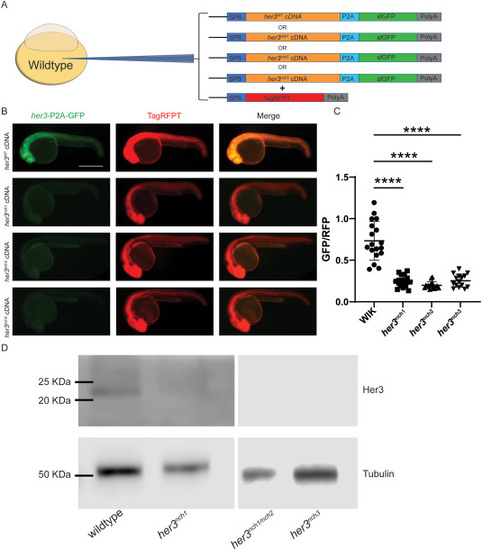
Fig. 2. Validating her3 frameshift mutations. (A) Schematic of strategy for her3 mRNA expression assay. Zebrafish embryos were co-injected with a mixture of two different mRNAs: one of four different her3-P2A-sfGFP generated from either wildtype her3 or each of the three mutant her3 zebrafish; and a control TagRFPT mRNA. mRNA mixtures were injected into the yolk of zebrafish embryos at the 1–4 cell stage (see Fig. S5 for sequences). (B) At 24 h post fertilization (hpf), embryos were imaged on a Leica M205FA fluorescent microscope to quantify GFP and RFP fluorescence. GFP fluorescence indicates either the her3 wildtype or her3 mutant P2A-sfGFP construct, whereas TagRFPT is an injection control. Scale bar is 500 μm. (C) Plotted is the raw integrated density ratio of GFP to RFP fluorescence. Each point represents an individual fish. Wildtype (WIK): n = 18. nch1: n = 19. nch2: n = 16. nch3: n = 15. A Brown-Forsythe and Welch ANOVA was performed with Dunnett T3 multiple comparison test. The comparisons include wildtype WIK to her3 mutants with the following P values: WIK- her3nch1: p = 1.20 × 10⁻⁷. WIK- her3nch2: p = 5.24 × 10⁻⁸. WIK- her3nch3: p = 1.60 × 10⁻⁷. (D) Western blot of 6hpf embryos from her3nch1 and her3nch3 homozygotes, and a compound heterozygote for her3nch1/nch2. A cross-reactive human HES3 antibody was used to detect zebrafish wildtype Her3, and a Tubulin antibody was used as a loading control. EXPRESSION / LABELING:
|

Fig. 3. her3 null mutation recapitulates her3-morpholino phenotype. (A) qRT-PCR for her3 from each her3 null mutant line compared to the wildtype WIK. qRT-PCR was done with 3 biological replicates per line, with each replicate containing a pool of 10, 24hpf embryos. Each biological replicate is comprised of three technical replicates. Statistical significance was determined by a one way ANOVA with Dunnett multiple comparison test. WIK- her3nch1: p = 1.82 × 10⁻³. WIK- her3nch2: p < 1.00 × 10⁻⁴. WIK- her3nch3: p < 1.00 × 10⁻⁴. (B) qRT-PCR for her3 with WIK, her3-MO, and mismatch (mm)-MO. 5–10 nL of morpholinos at a concentration of 500 μM were injected into the yolk of WIK embryos at the 1–4 cell stage. qPCR was done with 3 biological replicates per condition, with each replicate containing a pool of 10, 24hpf embryos. Each biological replicate is comprised of three technical replicates. Statistical significance was determined by a one way ANOVA with Dunnett multiple comparison test. WIK-her3-MO: p < 1.0 × 10⁻⁴. WIK-mm-MO: p = 8.46 × 10⁻¹, not significant. (C) RNAscope on whole mount 24hpf WIK wildtype zebrafish embryos. RNAscope targeting her3 RNA transcripts (red) was done and counterstained with DAPI (blue). Representative image was taken on a Leica M205FA fluorescent stereoscope out of three embryos evaluated. Scale bar is 500 μm. (D–E) RNAscope targeting her3 RNA transcripts was done on 24hpf WIK (D) and 24hpf her3nch1 (E) embryos and counterstained with DAPI. Images were taken on a Zeiss LSM800 confocal microscope with a 20x objective. Images shown are z-stack projections: (D) WIK is a projection of 53, 2 μm slices; (E) her3nch1 is a projection of 48, 2 μm slices. her3 is shown in red and DAPI is shown in blue. (F) Quantification of the area of her3 expression from (D–E) indicated by white arrowheads. WIK and her3nch1: n = 3 embryos per condition. A Welch's two-tailed t-test had a p-value of 2.62 × 10⁻². |
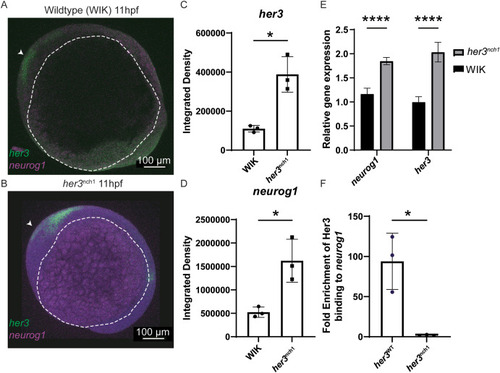
Fig. 4. her3 null mutation results in deregulation of neurog1 expression. (A–B) RNAscope confocal images of her3 (green) and neurog1 (purple) in 11hpf WIK (A) and 11hpf her3nch1 homozygous (B) embryos. White arrowhead denotes anterior of the embryo. White dotted line outlines the yolk of the embryos. (C–D) Integrated density of the her3 (C) and neurog1 (D) expression are quantified. Both WIK and her3nch1: n = 3 samples per condition. Statistical significance was determined by a Welch's two-tailed t-test. her3: p = 0.0306. neurog1: p = 0.0470. (E) qRT-PCR for neurog1 and her3 using 11hpf WIK and her3nch1 embryos. qRT-PCR includes four biological replicates per line, with each replicate containing a pool of 40, 11hpf embryos. Each biological replicate is comprised of three technical replicates. Statistical significance was determined by an unpaired Welch's t-test. neurog1 p = 2.11 × 10⁻⁴. her3 p = 4.14 × 10⁻⁴. (F) ChIP-qPCR using 6hpf WIK embryos injected with FLAG-tagged her3 mRNA cloned from either wildtype WIK zebrafish or her3nch1 zebrafish. For each mRNA injected, n = 3 biological replicates are shown from independent experiments. For each sample, one million zebrafish cells were combined with one million Rh30 cells (human rhabdomyosarcoma cell line) as carrier chromatin. After FLAG ChIP for the wildtype Her3 or Her3nch1 mutant construct, qPCR was performed targeting known Her3 binding sites in the neurog1 promoter. Fold enrichment was calculated by comparing FLAG tagged Her3 or Her3nch1 mutant binding in the neurog1 promoter as compared to a gene desert. Statistical significance (p = 4.46 × 10⁻²) was calculated using an unpaired Welch's t-test. EXPRESSION / LABELING:
PHENOTYPE:
|
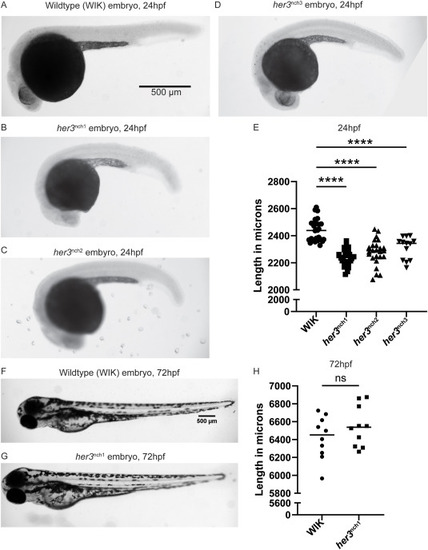
Fig. 5. her3 null mutant lines are significantly smaller than wildtype WIK at 24hpf. (A–D) Brightfield images of 24hpf wildtype WIK (A), 24hpf her3nch1 (B), 24hpf her3nch2 (C), and 24hpf her3nch3 (D) embryos. Images were taken on a Leica M205FA fluorescent stereoscope. Scale bar is 500 μm. (E) The standard length of each embryo was measured and graphed here. WIK: n = 28. her3nch1: n = 25. her3nch2: n = 25. her3nch3: n = 13. For each comparison to WIK, p < 1.00 × 10⁻⁴ using a one-way ANOVA with Dunnett test. (F–G) Brightfield images of 72hpf wildtype WIK (F) and 72hpf her3nch1 (G) embryos. (H) The standard length of each 72hpf embryo was also measured and graphed here. n = 10 for both WIK and her3nch1. Each point is an individual fish. An unpaired Welch's t-test indicated this comparison was not statistically significant. PHENOTYPE:
|
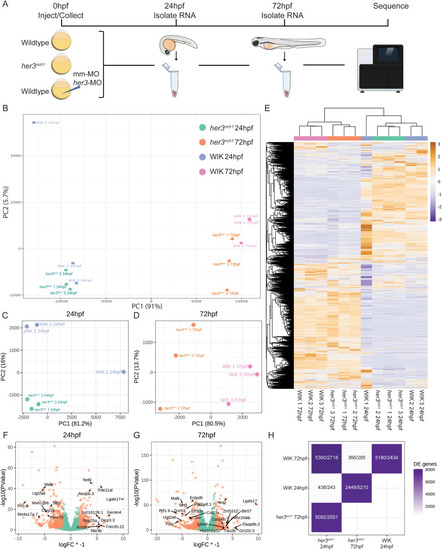
Fig. 6. Transcriptional impact of her3 mutation status. (A) Schematic of RNA collection. Embryos from wildtype WIK in-cross and her3nch1 in-cross were collected, with a subset of WIK embryos injected with either her3-MO or mismatch-MO. At 24hpf, RNA was isolated from 3 groups of 25 embryos each per condition, and again at 72hpf. RNA was then sent for sequencing. (B) PCA of all samples, excluding MO samples. (C–D) PCA of her3nch1 and WIK 24hpf samples (C) and 72hpf samples (D). (E) Heatmap clustering of all differentially expressed genes from her3nch1 and WIK samples. (F–G) Volcano plots of differentially expressed genes in her3nch1 compared to WIK 24hpf samples (F) and 72hpf samples (G). Differential expression was considered significant with an FDR ≤0.1 and absolute value of logFC ≥1.5. Top annotated up- and downregulated genes are labeled. (H) Tile chart showing pairwise comparisons of differentially expressed genes. Numbers are displayed as downregulated/upregulated of the groups along the x-axis. |
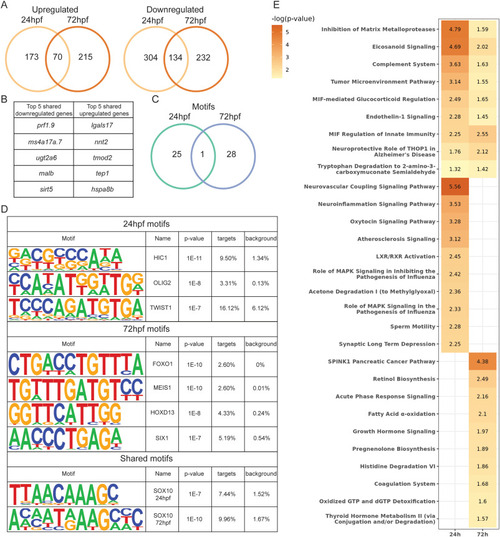
Fig. 7. Development and cancer genes and pathways are impacted by her3 null mutation. (A) Venn diagram showing overlap of differentially expressed genes from her3 null mutant between 24hpf and 72hpf embryos. (B) List of the top 5 up- and downregulated genes shared between 24hpf and 72hpf in the her3 null mutant. (C) Venn diagram of transcription factors with DNA binding motifs overlapping between 24hpf and 72hpf her3 null mutant embryos. Targets are the percentage of differentially expressed genes that contain the motif. Background is the percentage of non-differentially expressed genes that contain the motif. (D) Examples of motifs from Venn diagram in (C). (E) p-value chart showing IPA pathways that are significantly enriched with identified differentially expressed genes. |

ZFIN is incorporating published figure images and captions as part of an ongoing project. Figures from some publications have not yet been curated, or are not available for display because of copyright restrictions. PHENOTYPE:
|
|
ZFIN is incorporating published figure images and captions as part of an ongoing project. Figures from some publications have not yet been curated, or are not available for display because of copyright restrictions. PHENOTYPE:
|
Reprinted from Developmental Biology, 496, Kent, M.R., Calderon, D., Silvius, K.M., Kucinski, J.P., LaVigne, C.A., Cannon, M.V., Kendall, G.C., Zebrafish her3 knockout impacts developmental and cancer-related gene signatures, 1141-14, Copyright (2023) with permission from Elsevier. Full text @ Dev. Biol.