
|
Fig. 5
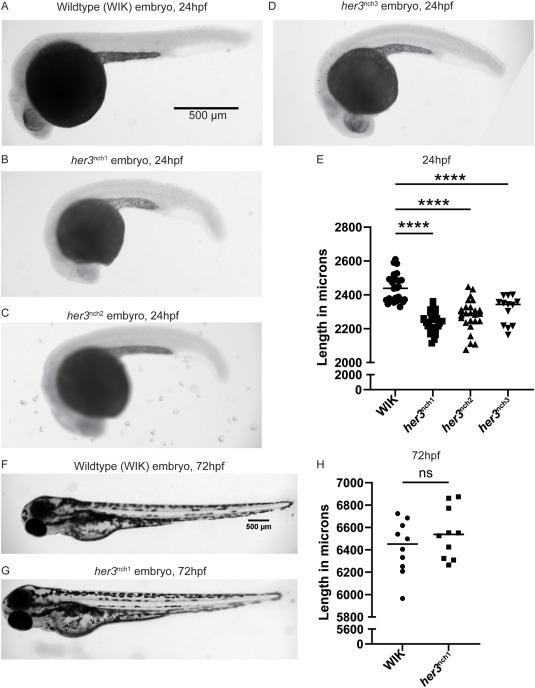
Fig. 5. her3 null mutant lines are significantly smaller than wildtype WIK at 24hpf. (A–D) Brightfield images of 24hpf wildtype WIK (A), 24hpf her3nch1 (B), 24hpf her3nch2 (C), and 24hpf her3nch3 (D) embryos. Images were taken on a Leica M205FA fluorescent stereoscope. Scale bar is 500 μm. (E) The standard length of each embryo was measured and graphed here. WIK: n = 28. her3nch1: n = 25. her3nch2: n = 25. her3nch3: n = 13. For each comparison to WIK, p < 1.00 × 10⁻⁴ using a one-way ANOVA with Dunnett test. (F–G) Brightfield images of 72hpf wildtype WIK (F) and 72hpf her3nch1 (G) embryos. (H) The standard length of each 72hpf embryo was also measured and graphed here. n = 10 for both WIK and her3nch1. Each point is an individual fish. An unpaired Welch's t-test indicated this comparison was not statistically significant.
Reprinted from Developmental Biology, 496, Kent, M.R., Calderon, D., Silvius, K.M., Kucinski, J.P., LaVigne, C.A., Cannon, M.V., Kendall, G.C., Zebrafish her3 knockout impacts developmental and cancer-related gene signatures, 1141-14, Copyright (2023) with permission from Elsevier. Full text @ Dev. Biol.