
- Title
-
Lasp1 Expression Is Implicated in Embryonic Development of Zebrafish
- Authors
- Grossi, I., Schiavone, M., Cannone, E., Grejdan, O.A., Tobia, C., Bonomini, F., Rezzani, R., Salvi, A., De Petro, G.
- Source
- Full text @ Genes (Basel)
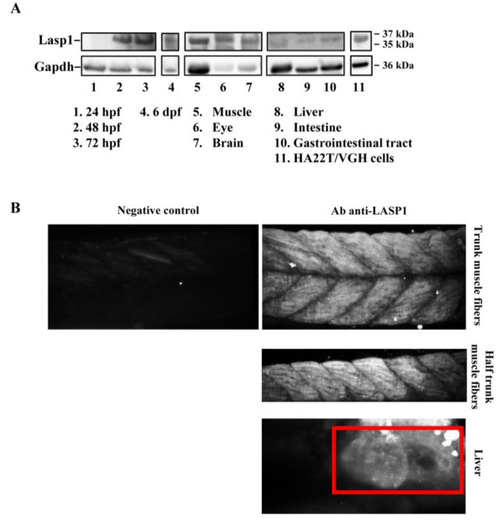
Detection of Lasp1 protein expression in zebrafish. (A) Western blotting analysis of Gapdh and Lasp1 at different embryonic stages (24 hpf, 48 hpf, 72 hpf and 6 dpf) and in different tissues from zebrafish adults (muscle, eye, brain, liver, intestine, and gastrointestinal tract tissues). Human hepatocellular carcinoma cells, HA22T/VGH, with high levels of LASP1, were used as positive controls. (B) Localization of Lasp1 evaluated using light-sheet fluorescence microscopy in zebrafish at 72 hpf. Overview of muscle fibers and liver. Negative control is a representative overview of the “trunk muscle fibers” without primary anti-Lasp1 antibodies and with the fluorescent-labeled secondary antibodies. The images are representative of at least two independent experiments. |

Detection of Lasp1 protein expression in various organs and tissues of zebrafish, including the muscle, the eye, the brain, the liver and the gastrointestinal tract. (A) Histological analysis by hematoxylin and eosin staining of muscle fiber, eye, brain, liver and intestinal tract tissue sections. Pancreas (a), liver (b), and intestine (c) samples are indicated. Magnification: 4× and 20×. (B) Immunofluorescence detection of Lasp1 (green) in the selected tissue sections by immunohistochemistry with Alexa photosensitive antibodies. Magnification: 20× and 63× (blue: DAPI; green: FITC). Scale bars are placed at the lower left corner of each image and correspond to 100 µm for 4× and 20× magnification and to 30 µm for 63× magnification. |
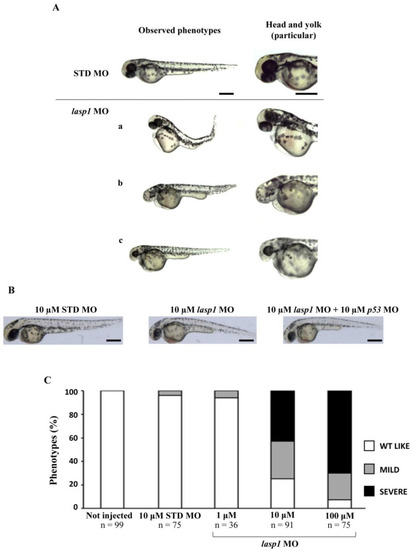
The evaluation of the morphological defects in lasp1 MO morphants. (A) Representative images of the phenotypes of zebrafish embryos injected with 10 µM control morpholino (STD MO) or 10 µM lasp1 MO and photographed at 48 hpf. Morphants exhibited different morphological defects, including the severe phenotype with underdeveloped body and heart edema (a); undeveloped eyes and reduced tail size ( PHENOTYPE:
|
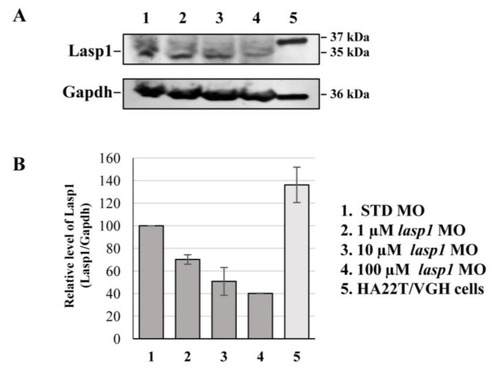
lasp1 MO morphants. (A) Representative Western blotting for Lasp1 protein level in 48 hpf embryos injected with STD MO or lasp1 MO at different doses (1, 10 and 100 µM). Human hepatocellular carcinoma cells (HA22T/VGH) were used as positive controls for LASP1 expression. Gapdh was used as an internal control. The images are representative of two independent experiments. (B) Relative quantifications of Lasp1 expression levels. The histograms represent the mean IOD (integrated optical density) values in percentages; the bars represent SDs from two independent experiments. |
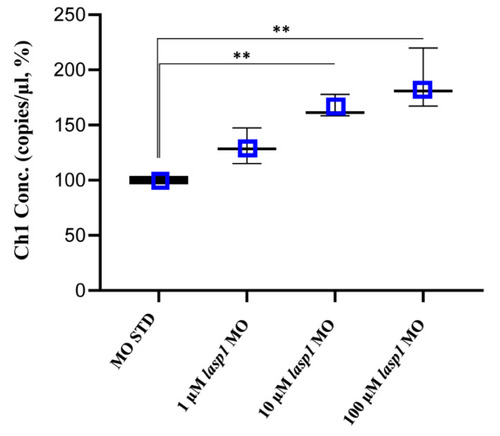
Absolute quantifications of lasp1 mRNA in lasp1 MO morphants using ddPCR. Dose-dependent increases in lasp1 mRNA levels were observed. The graph represents the average values of copies/μL referred to the MO STD samples; error bars are SDs. ** p < 0.01 in one-way ANOVA followed by Bonferroni testing. |
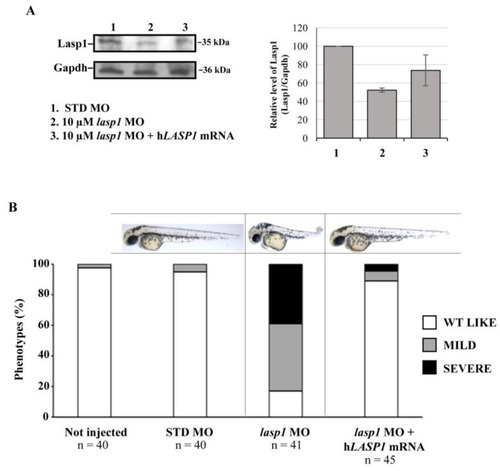
Co-injection of lasp1 MO and LASP1 mRNA rescues the morphological defects of morphants. (A) Representative Western blotting and relative quantifications of Lasp1 protein levels in 48 hpf embryos injected with STD MO, 10 µM lasp1 MO or co-injected with 10 µM lasp1 MO and LASP1 mRNA (50 ng). GAPDH was used as an internal control. The histograms represent the mean IOD (integrated optical density) values in percentages; the bars are SDs. (B) Analysis of phenotypes and corresponding representative images of the zebrafish embryos injected with 10 µM control morpholino (STD MO), 10 µM lasp1 MO or co-injected with 10 µM lasp1 MO and human LASP1 mRNA (50 ng) and photographed at 48 hpf. The number under each bar is the total number of embryos examined under each experimental condition. Three biological replicates were used for each assay. |
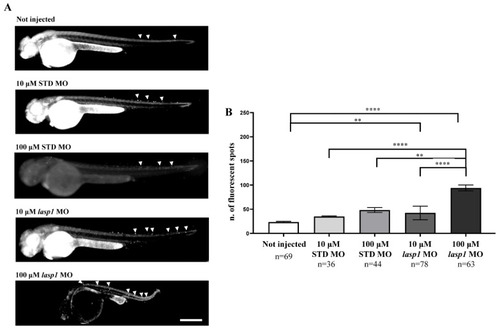
Injection of lasp1 MO increases apoptosis in zebrafish embryos at 48 hpf. (A) Representative images of acridine orange staining by fluorescence microscopy show increased apoptosis in whole embryos following injections of lasp1 MO at 10 µM and 100 µM doses. Fluorescence spots are evidenced by arrowheads. Scale bars: 200 µm. (B) The acridine orange-positive spots were counted using ImageJ. Histograms represent the average numbers of fluorescent spots; error bars are SEMs. ** p < 0.01 and **** p < 0.0001 in one-way ANOVA followed by Bonferroni testing. PHENOTYPE:
|