
- Title
-
Gene Expression Analysis in gla-Mutant Zebrafish Reveals Enhanced Ca2+ Signaling Similar to Fabry Disease
- Authors
- Elsaid, H.O.A., Tjeldnes, H., Rivedal, M., Serre, C., Eikrem, Ø., Svarstad, E., Tøndel, C., Marti, H.P., Furriol, J., Babickova, J.
- Source
- Full text @ Int. J. Mol. Sci.
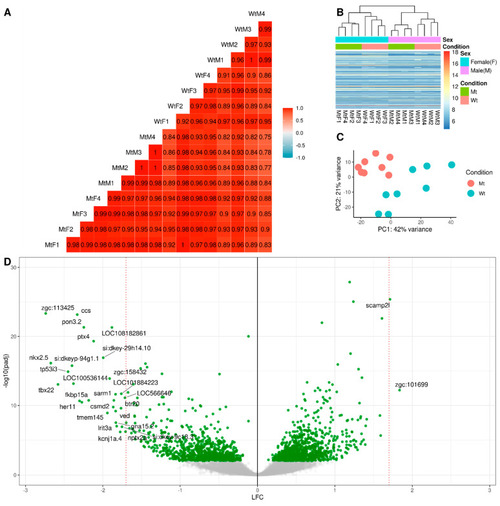
Quality Control and Fold Change. Total samples (n = 16), with sex-matched groups: MtM: Mutant Male (n = 4), MtF: Mutant Female (n = 4), WtM: Wild type Male (n = 4), WtF: Wild type Female (n = 4). (A) Pearson Correlation for pairwise comparison of mRNA FPKM between samples, rounded to 2 decimals; (B) Heatmap clustering of variance stabilized counts for all genes binned into five hundred clusters, showing that both sex and condition are clustering together; (C) PCA analysis of variance stabilized counts for all genes, with batch correction for both Sex and Replicates; (D) Volcano plot of Log2 fold change (LFC) for all genes using DESeq2 differential expression analysis, with resulting −log10 adjusted p-values. (Negative LFC means LFC (Mutant Mt) < LFC (Wild type Wt). A high confidence set of genes are displayed with gene symbols (adjusted p-value < 0.000001 and absolute value of LFC > 1.7). |
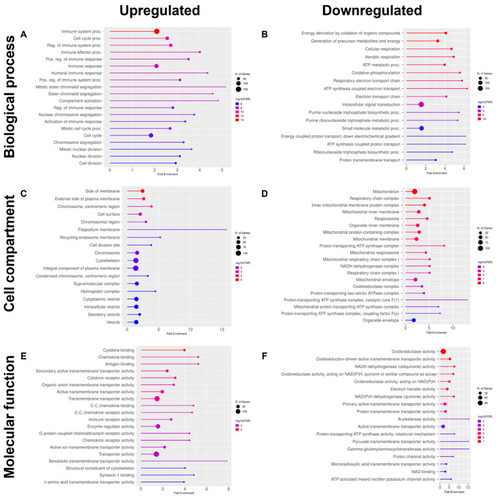
Gene ontology (GO) enrichment analysis of pathways upregulated and downregulated in renal tissues from the mutant, compared to wildtype ZF. Data refers to GO Biological Process (BP: (A) and (B), respectively), Cellular component (CC, (C) and (D), respectively) and Molecular function (MF: (E) and (F), respectively). In all cases, the twenty most enriched pathways are reported. FDR ≤ 0.05. |
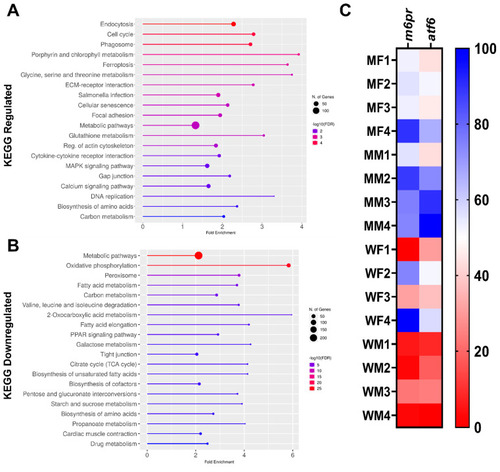
KEGG pathway enrichment analysis and heatmap of m6pr and atf6 genes in mutant compared to wildtype ZF. (A) KEGG pathways associated with the upregulated genes; (B) KEGG pathways associated with the downregulated genes; (C) heatmap (percentage column normalized, where dark blue is the maximum per column) showing the expression of the selected downregulated genes m6pr and atf6. |
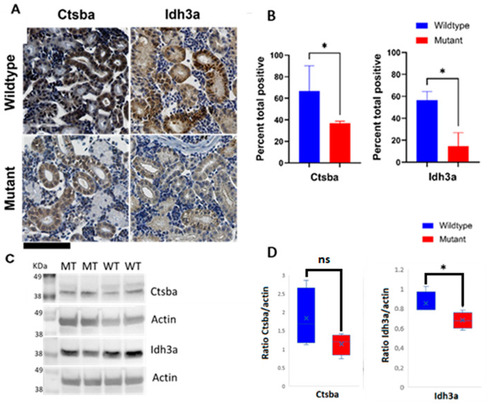
Immunohistochemical and Western blot detection of selected proteins in kidneys from WT and M ZF reveals protein expression disturbances in mitochondria and lysosomes. (A) Representative IHC staining specific for mitochondrial marker isocitrate dehydrogenase (NAD(+))3 alpha (Idh3a) and lysosomal marker cathepsin B (Ctsb) in kidney tissue sections from WT and M ZF (upper right and upper left panels, and lower right and lower left panels, respectively; (B) Quantification of immunohistochemical staining of sections from WT and M ZF kidneys. Signal intensity is significantly higher in WT than in M for both proteins. (C) Representative immunoblots of Ctsb and Idh3a in kidney tissue section from WT and M ZF; (D) Quantification of immunoblots from WT and M ZF kidneys. (Mann–Whitney test U * p < 0.05). Wildtype (WT), mutant (M). ns: not significant. Scale bar (bottom left corner, in black) = 100 µm. |