
Image
|
Figure Caption
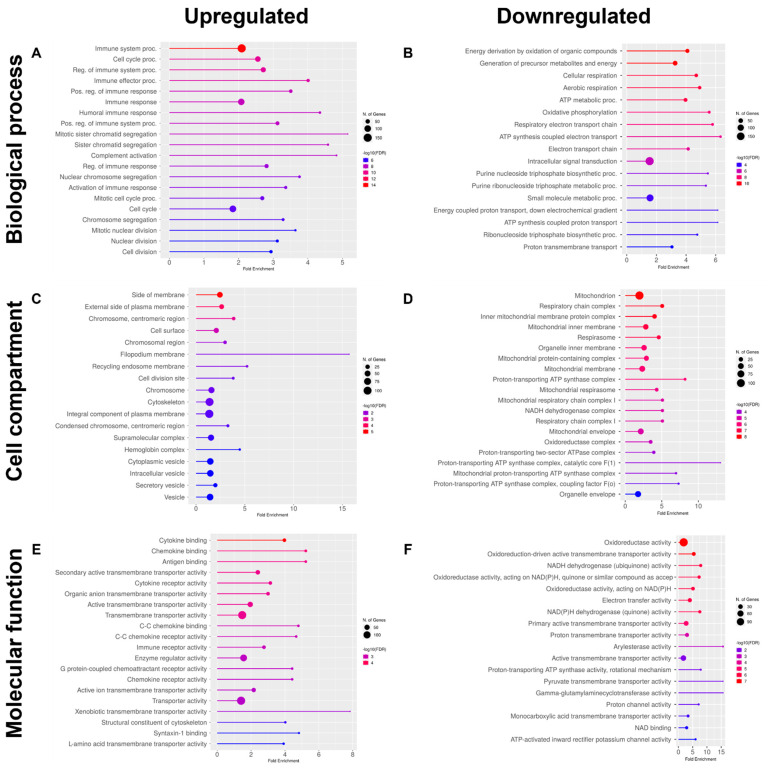
Figure 2
Gene ontology (GO) enrichment analysis of pathways upregulated and downregulated in renal tissues from the mutant, compared to wildtype ZF. Data refers to GO Biological Process (BP: (A) and (B), respectively), Cellular component (CC, (C) and (D), respectively) and Molecular function (MF: (E) and (F), respectively). In all cases, the twenty most enriched pathways are reported. FDR ≤ 0.05.
Acknowledgments
This image is the copyrighted work of the attributed author or publisher, and
ZFIN has permission only to display this image to its users.
Additional permissions should be obtained from the applicable author or publisher of the image.
Full text @ Int. J. Mol. Sci.