
|
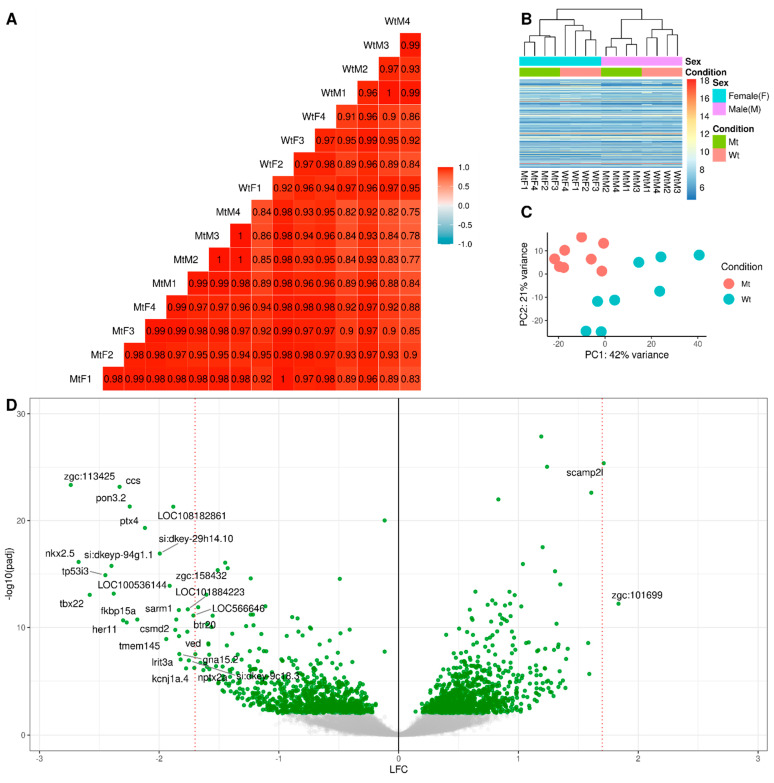
Figure 1
Quality Control and Fold Change. Total samples (n = 16), with sex-matched groups: MtM: Mutant Male (n = 4), MtF: Mutant Female (n = 4), WtM: Wild type Male (n = 4), WtF: Wild type Female (n = 4). (A) Pearson Correlation for pairwise comparison of mRNA FPKM between samples, rounded to 2 decimals; (B) Heatmap clustering of variance stabilized counts for all genes binned into five hundred clusters, showing that both sex and condition are clustering together; (C) PCA analysis of variance stabilized counts for all genes, with batch correction for both Sex and Replicates; (D) Volcano plot of Log2 fold change (LFC) for all genes using DESeq2 differential expression analysis, with resulting −log10 adjusted p-values. (Negative LFC means LFC (Mutant Mt) < LFC (Wild type Wt). A high confidence set of genes are displayed with gene symbols (adjusted p-value < 0.000001 and absolute value of LFC > 1.7).