
- Title
-
NemoTrainer: Automated Conditioning for Stimulus-Directed Navigation and Decision Making in Free-Swimming Zebrafish
- Authors
- Singh, B.J., Zu, L., Summers, J., Asdjodi, S., Glasgow, E., Kanwal, J.S.
- Source
- Full text @ Animals (Basel)

Diagrammatic representation of the audio-visual training apparatus for operant conditioning. For classical conditioning, a sensor trigger is not required. Fish-training/testing trials on stimulus-directed swimming were conducted in groups for classical conditioning and individually for operant conditioning. See text for additional details of the setup and |
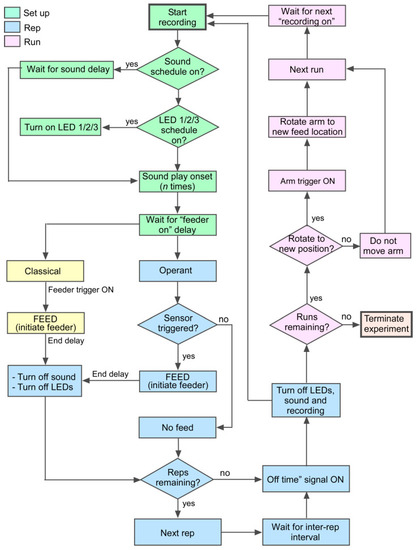
Flowchart depicting the algorithm for automated conditioning. The training procedure assigns user-defined delays for turning “on” and “off” light and sound or any other type of stimulus as part of the setup (green). Stimulus repetition (blue) provides multiple opportunities in close succession within each of multiple daily runs (pink) for the animal to learn the task. |
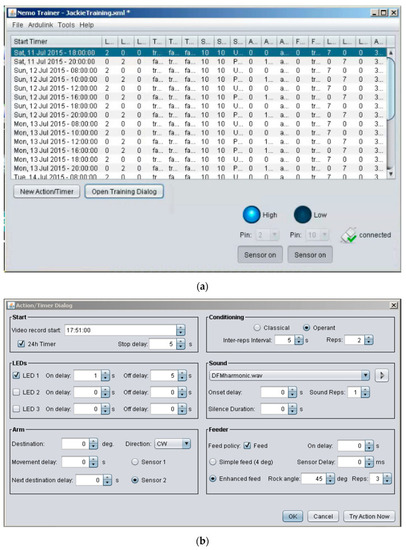
Screen captures of the user interface for the Java facility. (a) Scheduler-interface showing the training schedule for communication with Arduino. (b) Computer interface for monitoring sensors and control of associative conditioning. User-definable settings enable either classical or operant conditioning via customized multi-day scheduling and precise control of stimulus parameters for training. |
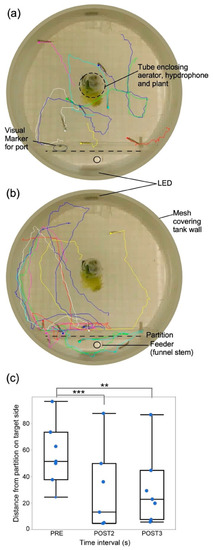
Tracking individual fish behavior. Tracks of swim paths of seven fish created using idTracker from video recordings (a) before, and (b) during presentation of a short, 4 s duration sound stimulus. Tracks begin at locations 1 s pre- and terminate 4 s post-sound onset. (c). Box plots and jittered scattergrams showing distances of fish (n = 6) from correct (target) side after training in response to the presentation of sounds within a single trial (4). Data were obtained from 1 s before (PRE) and during the second (POST2) and third (POST3) second post-stimulus. Shorter distances from target indicate better learning. On average, fish were closer to target during POST2 and started to wander away during POST3. ** indicate statistically significant and *** indicates highly significant difference between means (horizontal line within each box). One stationary fish trapped behind the divider was not tracked and another starting at the divider was not included in the analysis. Aerator and underwater speaker are on the right and feeder tube on the left. Perimeter shows glass wall reflection as the image was captured by a camera placed below the tank. |

Progression of learning in a single zebrafish during operant conditioning. (a): Fish does not show any overt response to the presentation of a sound stimulus. (b). Fish shows awareness and attempts to trigger the sensor on the correct (red) side, but is unsuccessful. (c). Fish successfully triggers the sensor twice to receive a food reward. Dotted lines indicate the swimming path obtained from individual frames in the recorded video of the fish. A shortening of the distance between successive dots along the swim path indicates slowing down of the fish after hearing the sound. Blue circles indicate time point of sound onset superimposed on the fish’s swimming path. Arrows next to the trajectory indicate the heading of the fish. Green arrows indicate trajectory early in time and red arrows indicate trajectory later in time. Sensor activation/beam-disruption was indicated by a small LED flash on the sensor board that is reflected back in water (red rectangles in the image). |
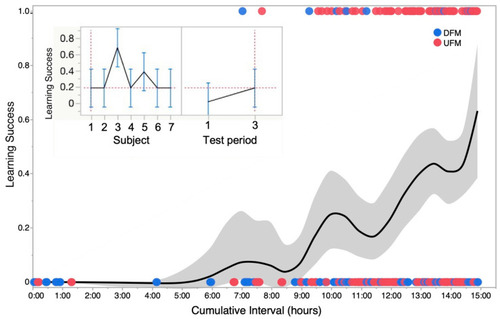
Learning curve and variability in operant conditioning across animals tested. The main plot shows a smoothed kernel spline fit to show the learning trend for a binomial distribution of failure (0) and success (1) in successive trials for one zebrafish summed for two types of sound stimuli—upward and downward frequency modulations labeled as UFM and DFM, respectively. Grey zone shows standard deviation of data points from mean plot at each time step or run. Inset: Profile plots generated from a repeated-measures analysis of variance (ANOVA) showing the cumulative success (mean ± stand. deviation) of seven zebrafish tested. Panel on left shows that overall, there was a significant (p < 0.05) “subject” effect mainly because of one individual (animal #3). Panel on right shows that significant (p < 0.05) learning was observed across all seven animals based on success rates for triggering sensor within the 8 s time window when averaged for the first and third set of runs occurring within a 12 to 24 h time frame (time interval over which learning occurred varied with individual fish). |