
|
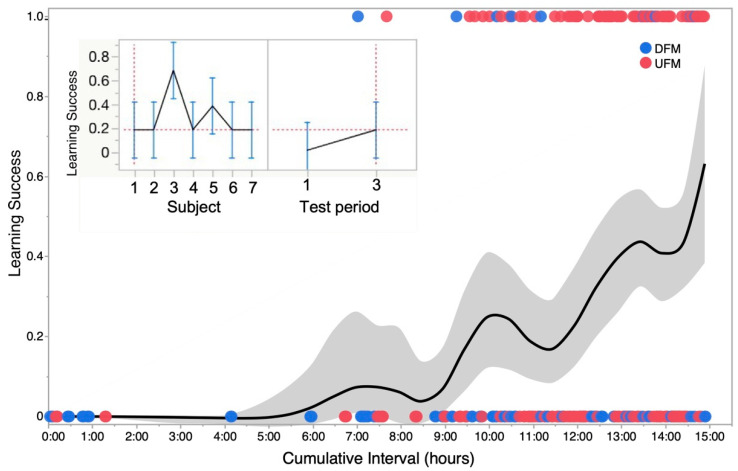
Figure 6 Learning curve and variability in operant conditioning across animals tested. The main plot shows a smoothed kernel spline fit to show the learning trend for a binomial distribution of failure (0) and success (1) in successive trials for one zebrafish summed for two types of sound stimuli—upward and downward frequency modulations labeled as UFM and DFM, respectively. Grey zone shows standard deviation of data points from mean plot at each time step or run. Inset: Profile plots generated from a repeated-measures analysis of variance (ANOVA) showing the cumulative success (mean ± stand. deviation) of seven zebrafish tested. Panel on left shows that overall, there was a significant (p < 0.05) “subject” effect mainly because of one individual (animal #3). Panel on right shows that significant (p < 0.05) learning was observed across all seven animals based on success rates for triggering sensor within the 8 s time window when averaged for the first and third set of runs occurring within a 12 to 24 h time frame (time interval over which learning occurred varied with individual fish).