
- Title
-
SCGN deficiency is a risk factor for autism spectrum disorder
- Authors
- Liu, Z., Tan, S., Zhou, L., Chen, L., Liu, M., Wang, W., Tang, Y., Yang, Q., Chi, S., Jiang, P., Zhang, Y., Cui, Y., Qin, J., Hu, X., Li, S., Liu, Q., Chen, L., Li, S., Burstein, E., Li, W., Zhang, X., Mo, X., Jia, D.
- Source
- Full text @ Signal Transduct Target Ther
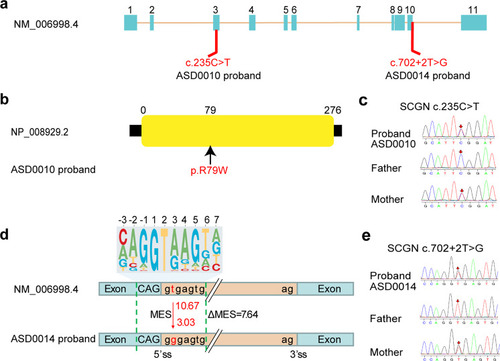
Mutations in SCGN are linked to ASD. a Schematic diagram of mutation sites in two ASD probands. b ASD0010 carries one heterozygous, missense mutation (R79W) in the SCGN gene. c Sanger sequencing traces of unaffected parents and affected ASD0010 proband. d ASD0014 carries a heterozygous mutation in SCGN immediately after exon 10, which likely affect gene splicing. 10.67 and 3.03 are predicted 5’ splice site score for WT and the mutation. The top panel is the 5’ splicing site motif. MES Maximum Entropy Score. e Sanger sequencing traces of unaffected parents and affected ASD0014 proband |

Scgn+/− and scgn−/− zebrafish show autistic-like behavior. a Schematic diagram of shoaling test. Inter-fish distance is recorded; b Scgn+/− and scgn−/− adult zebrafish (4 month old) displayed a significantly increased-fish distance in shoaling test, relative to their wild-type siblings. +/+:scgn+/+; +/−:scgn+/−; −/−:scgn−/−. *p < 0.05. P-values were calculated using one-way ANOVA, Tukey’s multiple comparisons test. c Frequency at different inter-fish distance in shoaling test. +/+:scgn+/+; +/−:scgn+/−; −/−:scgn−/−. ****p < 0.0001, ***p < 0.001, **p < 0.01, *p < 0.05. ns not significant. P-values were calculated using one-way ANOVA, Tukey’s multiple comparisons test. d Schematic diagram of two-sector social interaction test. Two stimulus zebrafish were placed in the left chamber. Border crossing is defined as moving from the interaction sector to the empty sector, or vice versa. e Heatmaps show that scgn+/+ zebrafish displayed remarkable higher frequency close to the stimulus zebrafish than scgn+/− and scgn−/− zebrafish. Warmer colors (red) indicate a greater amount of time spent exploring by the zebrafish. f Frequency of test fish in the interaction sector. ****p < 0.0001, **p < 0.01. P-values were calculated using one-way ANOVA, Tukey’s multiple comparisons test. g Frequency of border crossing between the interaction and the empty sectors. **p < 0.01. P-values were calculated using one-way ANOVA, Tukey’s multiple comparisons test. h Schematic diagram of a five-chamber social interaction tank for the visually mediated social preference test (VMSP). i–k Heatmap of scgn+/+ zebrafish in the adaption session (i), interaction session (j), and social novelty session (k). l–n Heatmap of scgn+/− zebrafish in the adaption session (l), interaction session (m), and social novelty session (n). o–q Heatmap of scgn−/− zebrafish in the adaption session (o), interaction session (p), and social novelty session (q). r Frequency in the interaction sector during the interaction session of scgn+/+, scgn+/−, and scgn−/− zebrafish. **p < 0.01, *p < 0.05. P-values were calculated using one-way ANOVA, Tukey’s multiple comparisons test. s Frequency in the novelty sector during the novelty session of scgn+/+, scgn+/−, and scgn−/− zebrafish. ****p < 0.0001, P-values were calculated using one-way ANOVA, Tukey’s multiple comparisons test. All experiments were performed in three repetitions |

Scgn deficiency impairs neuronal development, and R79W mutation is functionally impaired. a Bright-field images of zebrafish embryos classified in three groups based on head and body morphology at 48 hpf (hours post fertilization). Microcephalic: the brain size is moderately reduced; delayed: fish development is severely delayed, and the brain size is significantly reduced. Scale bar, 100 μm. b Percentage of embryos in each group as defined in A. N stands for the number of embryos examined from three independent experiments. +/+: scgn+/+; +/−: scgn+/−; −/−: scgn−/−. c Relative length of eyes of embryos at 48 hpf. Experiments were repeated three times. ****p < 0.0001, **p < 0.01. P-values were calculated using one-way ANOVA, Tukey’s multiple comparisons test. d Relative distance between a pair of eyes of embryos at 48 hpf. Experiments were repeated three times. ***p < 0.001, ns not significant. P-values were calculated using one-way ANOVA, Tukey’s multiple comparisons test. e Classification of zebrafish embryos based on the expression level of HuC (elavl3) at 48 hpf. Reduce: the brain size is moderately decreased; Extremely reduced, the brain size is significantly reduced.(Top) Lateral views; (Bottom) dorsal views. f Percentage of embryos in each group as defined in E. N stands for the number of embryos used for statistical analysis. All experiments were performed in three repetitions. g Multispecies alignment of SCGN protein sequences, Sequence of the ASD0010 proband is included as a comparison. h Detailed view of zebrafish SCGN Q75 (yellow stick, equivalent to human R79) and its surrounding residues (PDB:6JLH). Residues located within 4 Å of Q75 are shown in stick representation. i Hb9 (green) expression in Tg [Hb9: GFP] transgenic zebrafish. Enlarged views are shown. Ctl: control MO injection; MO: scgn MO injection; MO + WT: co-injection of scgn MO and wide-type human scgn mRNA; MO + R79W: co-injection of scgn MO and mRNA encoding SCGN R79W; MO + R79Q: co-injection of scgn MO and mRNA encoding SCGN R79Q. All injections were performed at one-cell stage of the Tg [Hb9: GFP]ml2 transgenic zebrafish embryos. Scale bar: 20 μm. j Statistical results of the length of CaP axons in embryos were treated as in c. For each group, ~48 axons from 6 to 12 Tg [Hb9: GFP]ml2 transgenic zebrafish embryos are scored. Experiments were repeated three times. ****p < 0.001, ***p < 0.001, ns not significant. P-values were calculated using one-way ANOVA, Tukey’s multiple comparisons test. All experiments were performed in three repetitions |
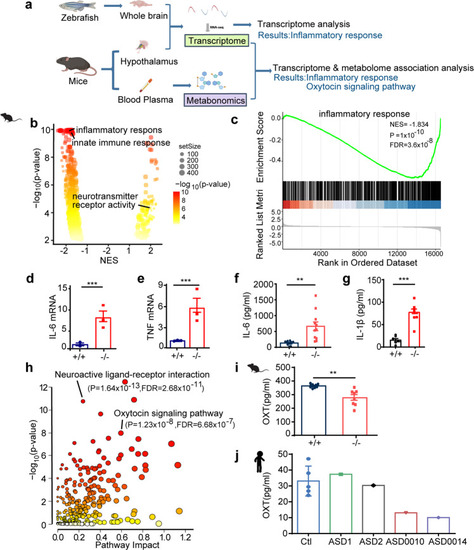
Integrated omics identify SCGN as a key regulator of immune response and oxytocin signaling pathways. a Multi-omics profiling of zebrafish and mice samples. Zebrafish whole brain and Mice hypothalamus were extracted for transcriptome analysis. Mice serum was collected for metabolome analysis. Transcriptome and metabolome from mice were further integrated for association analysis. b Volcano plots of GSEA results based on differentially expressed genes in the hypothalamus of scgn+/+ and scgn−/− mice. The dot color indicated the −log10 p-value in each pathway, while the dot size represented the gene number of each pathway. NES Normalized Enrichment Score. Volcano plots shows inflammatory and immune response pathways were signatures based on mice transcriptome analysis. c GSEA plot shows the signatures of the immune response in hypothalamu transcriptomes by scgn−/− mice compared to scgn+/+ mice. NES Normalized Enrichment Score. P, p-value. FDR False Discovery Rate. d, e Relative mRNA expression of immune and inflammation related genes upon brain tissue in scgn+/+ and scgn−/− mice after exposure to Bleed challenges (n = 3). d IL-6; e TNF. N = 3 for each group. Data were presented as mean ± SD, P-values were calculated using one-way ANOVA, Tukey’s multiple comparisons test. ***p < 0.001, **p < 0.01, *p < 0.05, ns not significant. f Plasma IL-6 protein level is increased in scgn−/− mice relative to control. **p < 0.01. Differences among groups by unpaired Student t-test. Experiments above were repeated three times. g Plasma IL-1β protein level is increased in scgn−/−mice. ***p < 0.001. P-values were calculated using unpaired Student t-test. Experiments above were repeated three times. h Mice transcriptome& metabolome association analysis reveals difference of oxytocin signaling pathways and neuroactive ligand-receptor interaction. i Plasma oxytocin concentrations of scgn−/− mice is decreased. N = 8 for each group. Data were presented as mean ± SD, P-values were calculated using one-way ANOVA, Tukey’s multiple comparisons test. **p < 0.01. j Plasma concentrations of oxytocin in 3 control individuals, 2 ASD children without scgn mutation, ASD0010 and ASD0014 proband. ASD0010 and ASD0014 showed a lower plasma oxytocin levels than control and ASD1, ASD2. Ctl: control, healthy children; ASD1 and ASD2: ASD probands who do not carry scgn mutations; ASD0010: ASD individual carries mutation SCGN p.R79W; ASD0014: ASD individual with mutation scgn c.702 + 2 T > G. All individual in this test ages are around 3 years old. Experiments above were repeated three times |
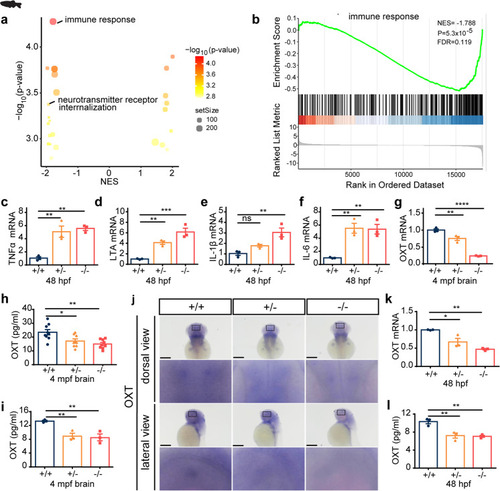
Scgn deficiency impairs immune response and decrease oxytocin secretion in zebrafish. a Volcano plots of GSEA results based on differentially expressed genes in the brains of 4 month old of scgn+/+ and scgn−/− zebrafish. The dot color indicated the −log10 p-value in each pathway, while the dot size represented the gene number of each pathway. b GSEA plot showed the signatures of the immune response in transcriptomes in scgn+/+ and scgn−/− zebrafish brains. NES Normalized Enrichment Score. P p-value. FDR False Discovery Rate. c–f Relative mRNA expression of immune and inflammation related genes upon scgn+/+ and scgn−/− zebrafish. c TNFα; d LTA; e IL-1β; f IL-6. N = 3 for each group. +/+: scgn+/+, +/−: scgn+/−, −/−: scgn−/−. Data were presented as mean ± SD, P-values were calculated using one-way ANOVA, Tukey’s multiple comparisons test. ***p < 0.001, **p < 0.01, *p < 0.05, ns not significant. g Relative mRNA expression of oxytocin in adult fish brain. N = 3 for each group. Data were presented as mean ± SD, P-values were calculated using one-way ANOVA, Tukey’s multiple comparisons test. ****p < 0.0001, **p < 0.01. h Scgn−/− and scgn+/− had lower brain oxytocin concentrations than scgn+/+. +/+: scgn+/+, +/−: scgn+/−, −/−: scgn−/−. N = 3 for each group. Data were presented as mean ± SD, P-values were calculated using one-way ANOVA, Tukey’s multiple comparisons test. **p < 0.01, *p < 0.05. g Relative mRNA expression of oxytocin in adult fish brain. N = 3 for each group. Data were presented as mean ± SD, P-values were calculated using one-way ANOVA, Tukey’s multiple comparisons test. ****p < 0.0001, **p < 0.01. i Scgn−/− and scgn+/− had lower plasma oxytocin concentrations than scgn+/+. Data were presented as mean ± SD, P-values were calculated using one-way ANOVA, Tukey’s multiple comparisons test. **p < 0.01. N = 3. j Whole-mount in situ hybridization in dorsal view (Top) and lateral view (Down) of oxytocin in 48 hpf zebrafish embryos upon scgn+/+, scgn+/−, and scgn−/−. The black rectangles label the position of oxytocin+ cells. Scale bar: 120 μm. k QRT-PCR analysis of the relative transcription level of oxytocin at 48 hpf upon 3 groups. N = 3 for each group. Data were presented as mean ± SD, P-values were calculated using one-way ANOVA, Tukey’s multiple comparisons test. **p < 0.01, *p < 0.05. l Oxytocin concentration levels in 48 hpf upon scgn+/+, scgn+/−, and scgn−/−. Data were presented as mean ± SD, P-values were calculated using one-way ANOVA, Tukey’s multiple comparisons test. **p < 0.01 |
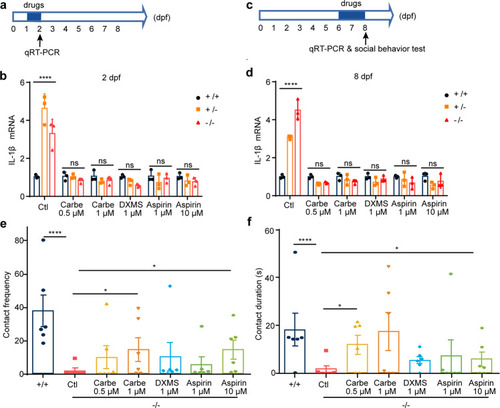
Administration of oxytocin analogue, dexamethasone and aspirin restores immune response and social behavior in zebrafish. a Experimental set-up and drugs exposure to 1-day-old embryos. Zebrafish larvea are performed with different concentration drugs (carbetocin, dexamethasone, or aspirin), respectively. qRT-PCR analysis of the relative transcription level of IL-1β at 2 dpf upon three groups. b Carbetocin, DXMS, and aspirin markedly decreases expression of pro-inflammatory cytokines IL-1β, Ctl, egg-water administration, Carbe 0.5 μM, Carbetocin 0.5 μM treatment; Carbe 1 μM, Carbetocin 1 μM treatment; DXMS 1 μM, dexamethasone 1 μM treatment; Aspirin 1 μM, Aspirin 1 μM treatment; Aspirin 10 μM, Aspirin 10 μM treatment. +/+: scgn+/+, +/−: scgn+/−, −/−: scgn−/−. DXMS Dexamethasone, a synthetic corticosteroid used to treat inflammation, Aspirin also known as acetylsalicylic acid. P-values were calculated using one-way ANOVA, Tukey’s multiple comparisons test. ****p < 0.0001. Ns, not significant. c Six-day-old embryos were exposed to drugs for 2 days, respectively. IL-6 level and social behavior tests were performed on 8 dpf. d Carbetocin, DXMS and aspirin markedly decreases expression of IL-1β. P-values were calculated using one-way ANOVA, Tukey’s multiple comparisons test. ****p < 0.0001. Ns not significant. e Contact frequency in larvea are rescued with Carbetocin and aspirin administration. +/+: scgn+/+, −/−: scgn−/−. P-values were calculated using one-way ANOVA, Tukey’s multiple comparisons test. ****p < 0.0001. *p < 0.05. f Duration of larvae body contact can be rescued with Carbetocin and aspirin administration. +/+: scgn+/+, −/−: scgn−/−. P-values were calculated using one-way ANOVA, Tukey’s multiple comparisons test. ****p < 0.0001.*p < 0.05 |

Oxytocin treatment increases social novelty and decreases repetitive behaviors in SCGN-deficiency mice. a Schematic of social novelty recognition (three-chamber) test. Time spent interacting with S1(a familiar mouse) or S2 (a novel mouse) is shown for each genotype when injected with Control-shRNA EGFP and Scgn-shRNA EGFP AAV virus in PVN. b Representative heatmaps showing the duration and location of the shControl and shScgn mice during the 10 min social novelty recognition test. Warmer colors (red) indicate a greater amount of time spent exploring by the mice. shControl: PVN Control-shRNA injection mouse. shScgn: PVN Scgn-shRNA injection mouse. DMSO: 0.1% DMSO administration. OXT: 1 mg/kg Oxytocin administration. S1: a familiar mouse. S2: a novel mouse. c Bar chart showing chamber times spending interacted with S1 or a novel mouse S2 of shControl and shScgn mouse. S1: a familiar mouse. center: center region in chamber. S2: a novel mouse. shScgn: PVN Scgn-shRNA injection mouse. DMSO: 0.1% DMSO administration. OXT: 1 mg/kg Oxytocin administration. S1: a familiar mouse. S2: a novel mouse. P-values were calculated using one-way ANOVA, Tukey’s multiple comparisons test. ***p < 0.001, *p < 0.05. ns not significant. d Bar chart showing sniffing times spending with S1 or S2 of shControl and shScgn mouse. DMSO: 0.1% DMSO-treated. OXT: 1 mg/kg Oxytocin-treated. P-values were calculated using one-way ANOVA, Tukey’s multiple comparisons test. ***p < 0.001, *p < 0.05. e Statistics of the social preference index (S2-S1/total) from chamber time in c. P-values were calculated using t-test. ***p < 0.001, **p < 0.01. (f) Statistics of the social preference index (S2-S1/total) from sniffing time in d. P-values were calculated using t-test. ***p < 0.001. g Statistics of marbles burying numbers in shControl and shScgn mice treated with DMSO or OXT. The data are presented as the mean ± SD. n = 12. ***p < 0.001. ns not significant. h Statistics of self-grooming times in shControl and shScgn mice treated with DMSO or OXT. The data were presented as the mean ± SD. n = 12. ***p < 0.001. ns not significant |
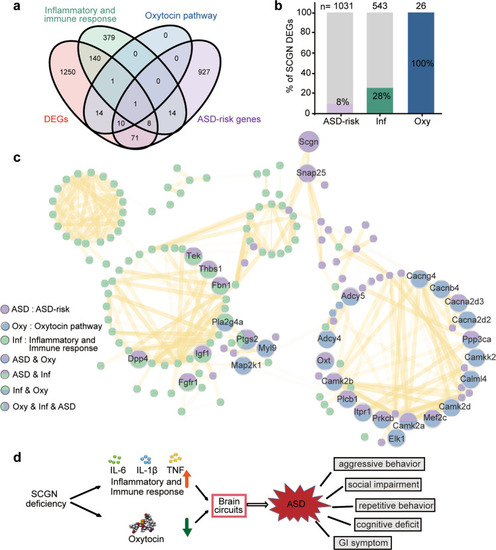
SCGN connects oxytocin and immune response pathways with ASD. a Venn-diagram showing the overlap genes between four different gene sets: DEGs: the differentially expressed genes detected in Scgn−/− mice RNA-seq. Inflammatory and immune response: the genes enriched in inflammatory and immune response by GSEA. Oxytocin pathway: the genes enriched in oxytocin pathway. ASD-risk genes: the genes related with ASD based on SFARI. b The number and ratio of SCGN DEGs associated with ASD, immune response, and oxytocin signaling pathway. 1495 genes that are differentially expressed in the brains of Scgn+/+ and Scgn−/− mice are used for analysis. ASD-risk ASD-risk genes from the SFARI database (March 2022). Inf inflammatory and immune response, Oxy oxytocin pathway. N stands for the number of genes in the KEGG database. c The network representing protein interaction relationship between DEGs in ASD-risk, oxytocin pathway. inflammatory and immune response based on scgn−/− mice RNA-seq. The interaction confidence was filtered by 0.7. The line transparency indicated the degree of confidence. Purple dots represent ASD-risk genes, blue represent genes associated with the oxytocin pathway, green represent genes associated with inflammatory and immune responses, and the multicolor dots indicate overlap of function and pathway. d SCGN deficiency impairs oxytocin secretion and activates the inflammatory pathway, increasing the risk of ASD. Conversely, SCGN deficiency can be treated by administration of oxytocin and/or anti-inflammatory drugs |