
- Title
-
Craniofacial and cardiac defects in chd7 zebrafish mutants mimic CHARGE syndrome
- Authors
- Sun, Y., Kumar, S.R., Wong, C.E.D., Tian, Z., Bai, H., Crump, J.G., Bajpai, R., Lien, C.L.
- Source
- Full text @ Front Cell Dev Biol
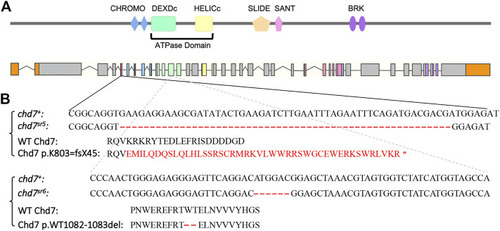
Generation of chd7 zebrafish mutants. (A) Schematics of Chd7 protein and chd7 gene structure. Chd7 protein contains double CHROMO domains, an ATPase domain including a DEXDc and HELICc domain, a SLIDE/SANT domain, and double BRK domains. (B) Sequence of the chd7 sr5 and chd7 sr6 mutants. Chd7 sr5 contains a 55-bp deletion in the fifth exon of chd7, which generated a truncation after the first chromo domain. The deletion created a 44-amino acid frame-shift followed by a stop codon. Chd7 sr6 has a mutation in the twelfth exon, which encodes the DEXDc domain, and causes a deletion of two amino acids, tryptophan and threonine. |
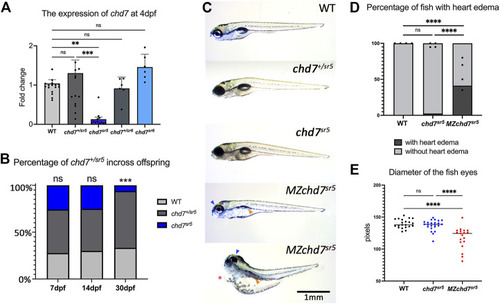
Overall phenotypes of chd7 mutants. (A) Expression of chd7 in chd7 sr5 and chd7 sr6 larvae at 4 dpf. The fold change of chd7 expression compared to WT was shown. (B) Percentage of the surviving offspring from chd7 sr5 incross (n > 40 for each time point). (C) Bright field images of chd7 sr5 and MZchd7 sr5 mutants at 7 dpf. MZchd7 sr5 fish have a smaller swim bladder (yellow arrowhead), pericardial edema (red asterisk), and small eyes (blue arrowhead). (D) Quantification of heart edema. Nearly 40% of MZchd7 sr5 fish have heart edema; however, chd7 sr5 fish do not show heart edema phenotypes. WT: n = 879, chd7 sr5 : n = 747, MZchd7 sr5 : n = 751. (E) Quantification of the small eye phenotype. The longest diameter of the dissected eye was measured. The eye size of the MZchd7 sr5 mutants is significantly reduced (n = 22 for each group). Statistical analyses were performed using the ordinary one-way ANOVA test for (A,E) and chi-square test for (B,D). ns: p ≥ 0.05, *: p < 0.05, **: p < 0.01, ***: p < 0.001, and ****: p < 0.0001. |

Craniofacial phenotype characterization in chd7 sr5 mutants. (A) Viscerocranium morphology. The viscerocranium was dissected out from the Alcian blue and Alizarin red costained WT, chd7 sr5, and MZchd7 sr5 mutants with or without heart edema at 7 dpf. Yellow arrowheads indicate the reduction in the IV ceratobranchial; black asterisks mark the defects in the teeth; red asterisks mark the abnormalities in the basihyal. (B) Quantification of the different types of the morphology of basihyal in WT, chd7 sr5, and MZchd7 sr5. (WT: n = 16; chd7 sr5 : n = 16; MZchd7 sr5 : n = 15). The statistical analysis was performed using the chi-square test. (C) Schematic of the viscerocranium cartilage at 7 dpf. bb, basibranchial; bh, basihyal; cb, ceratobranchial; ch, ceratohyal; hb, hypobranchial; hs, hyosymplectic; ih, interhyal; m, Meckel’s; and pq, palatoquadrate. (D) Quantification of the length of I to V ceratobranchials in WT, chd7 sr5, and MZchd7 sr5 . (WT: n = 24; chd7 sr5 : n = 20; MZchd7 sr5 : n = 23). The statistical significance was performed using the ordinary one-way ANOVA test. (E) Quantification of different types of the morphology of the IV ceratobranchial. (n = 22 for each group). The statistical analysis was performed using the chi-square test. (F) High-magnification image shows that chondrocyte stacking is disrupted in chd7 sr5 mutants, and severely disorganized stacking has been found in MZchd7 sr5 mutants. (G) Schematic of chondrocytes’ stacking measurement. (H) Angles of three neighbor chondrocytes in I and II ceratobranchials. Each number indicates a different fish. (n = 6 for each group). The significance was calculated between different groups. chd7 sr5 mutants have mild disorganization in the chondrocyte arrangement, but MZchd7 sr5 mutants have more severe defects in the chondrocytes. The statistical analysis was performed using the ordinary one-way ANOVA test. (I) Alizarin red-stained teeth are reduced in chd7 sr5 mutants at 7 dpf. Nearly 50% of MZchd7 sr5 fish have defects in teeth number. (WT: n = 23; chd7 sr5 : n = 20; MZchd7 sr5 : n = 38). The statistical significance was performed using the chi-square test. ns: p ≥ 0.05, *: p < 0.05, **: p < 0.01, ***: p < 0.001, and ****: p < 0.0001. PHENOTYPE:
|
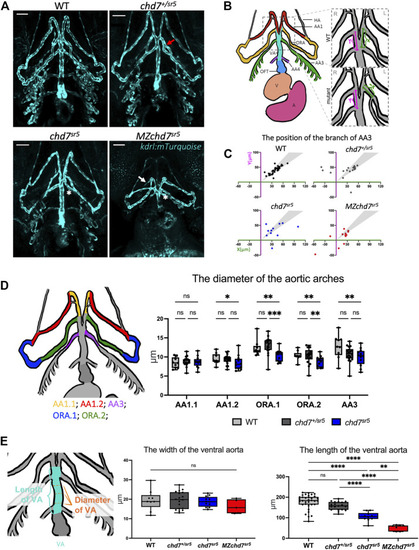
chd7 sr5 mutants show defects in arch artery patterning and ventral aorta length. (A) Ventral view of the kdrl:mTurquois fish at 102 hpf. 20x stacked confocal image, number of stacks: WT n = 25 (interval = 5 µm), chd7 sr5/+ n = 17 (interval = 7.5 µm), chd7 sr5 n = 20 (interval = 7.5 µm), and MZchd7 sr5 n = 21 (interval = 7.5 µm). Scale bar = 50 µm. (B) Schematic of ventral view of the zebrafish vasculature system at 102 hpf. The enlarged/zoomed in schematic illustrated the abnormal AA3 branching observed in some of the chd7 mutants. The distance between the branching points of the ORA and AA3 along the VA was measured. X = the length on the left side of the fish, Y = the length on the right side of the fish. If the AA3 branches off from the ORA instead of the VA, a negative value is used to quantify the length. AA, aortic arch; AA1, mandibular arch; ORA, opercular artery; AA3, first branchial arch; AA4, second branchial arch; HA, hypobranchial artery; VA, ventral aorta; OFT, outflow tract; V, ventricle; and A, atrium. (C) Quantification of the branching positions of the AA3 on the left and right side of WT, chd7 sr5, and MZchd7 sr5 as X and Y coordinates. Each spot in the scatter diagram indicates one single fish. The gray area represents the range of symmetric distributions, in which the differences of the distance between X and Y is less than 15%. (WT: n = 34, chd7 +/sr5 : n = 19, chd7 sr5 : n = 11, and MZchd7 sr5 : n = 14). (D) Schematic and data quantification of the diameter of the AA1, ORA, and AA3. Due to the variation in the diameter at different segments of the vessels, AA1 and ORA were separated into AA1.1 and AA1.2 and ORA.1 and ORA.2, respectively. (WT: n = 9, chd7 +/sr5 : n = 18, and chd7 sr5 : n = 12). The statistical analysis was performed using the two-way ANOVA test (mixed-effects analysis). (E) Schematic and data quantification of the width and length of the OFT. The mean diameter of the VA was used for quantification. The statistical analysis was performed using the ordinary one-way ANOVA test. (WT: n = 34, chd7 +/sr5 : n = 19, chd7 sr5 : n = 11, and MZchd7 sr5 : n = 14). ns: p ≥ 0.05, *: p < 0.05, **: p < 0.01, ***: p < 0.001, ****: p < 0.0001. |
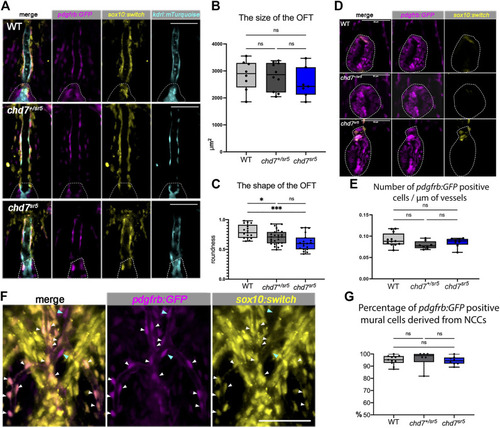
Cardiac NCCs and mural cells are not affected in the VA and OFT of chd7 sr5 mutants at 7 dpf. (A) sox10:switch (pseudo-colored yellow) positive NCCs contribute to pdgfrb:GFP (pseudo-colored magenta) positive mural cells around the VA in WT, chd7 +/sr5 , and chd7 sr5 fish. 40X single-slice confocal images at the thickest z position of the VA. Dotted lines circled the OFT. (B) Quantification of the size of the OFT in WT, chd7 +/sr5 , and chd7 sr5 fish. (WT: n = 8, chd7 +/sr5 : n = 10, and chd7 sr5 : n = 7). (C) Roundness analysis of the shape of OFT in WT, chd7 +/sr5 , and chd7 sr5 fish. (WT: n = 17, chd7 +/sr5 : n = 26, chd7 sr5 : n = 19). (D) Very few sox10:switch-labeled NCCs contribute to the OFT (circled by the dotted lines). 40X single-slide confocal images at the widest z position of the OFT. (E) Quantification of the distribution of the pdgfrb:GFP-positive cells along the vessel. The distribution is determined using the total length of the vessel divided by the total pdgfrb:GFP-positive cells. (WT: n = 12, chd7 +/sr5 : n = 8; chd7 sr5 : n = 8). (F) Representative images of the pdgfrb:GFP and sox10:switch-positive cells along the aortic arches. White arrowheads indicate NCC-derived (sox10:switch) pdgfrb:GFP-labeled mural cells; blue arrowheads indicate the pdgfrb:GFP single positive mural cells. 40X confocal stacked images, stack number n = 2, interval = 6 µm. (G) Quantification of the percentage of pdgfrb: GFP positive mural cells derived from NCCs (sox10: switch positive) along the AAs. Scale bar = 50 µm for all images. The statistical analysis was performed using the ordinary one-way ANOVA test for all data quantifications. (WT: n = 11, chd7 +/sr5 : n = 6; chd7 sr5 : n = 8). ns: p ≥ 0.05, *: p < 0.05, **: p < 0.01, ***: p < 0.001, and ****: p < 0.0001. PHENOTYPE:
|
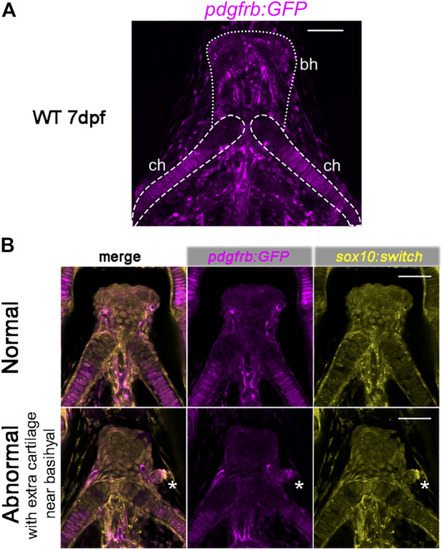
Expression of pdgfrb:GFP in craniofacial cartilages. (A) pdgfrb:GFP (pseudo-colored magenta) expression level is higher in the posterior part of the ceratohyal. 20X confocal stacked images, number of stacks n = 7, interval = 12 µm. (B) Representative images for the normal and abnormal basihyal in chd7 sr5 mutant fish. The abnormal one has extra cartilage near the basihyal cartilage, which expresses more pdgfrb:GFP compared to the basihyal cartilage and the nearby ceratohyal. sox10:switch (pseudo-colored yellow) labels NCCs. The white asterisks mark the extra cartilage. 20X single-slice confocal image. ch: ceratohyal; bh: basihyal (the number of fish with extra cartilage: WT: 0 in 6, chd7 +/sr5 : 1 in 13, and chd7 sr5 : 4 in 14). Scale bar = 50 µm for all images. EXPRESSION / LABELING:
|