
|
FIGURE 6
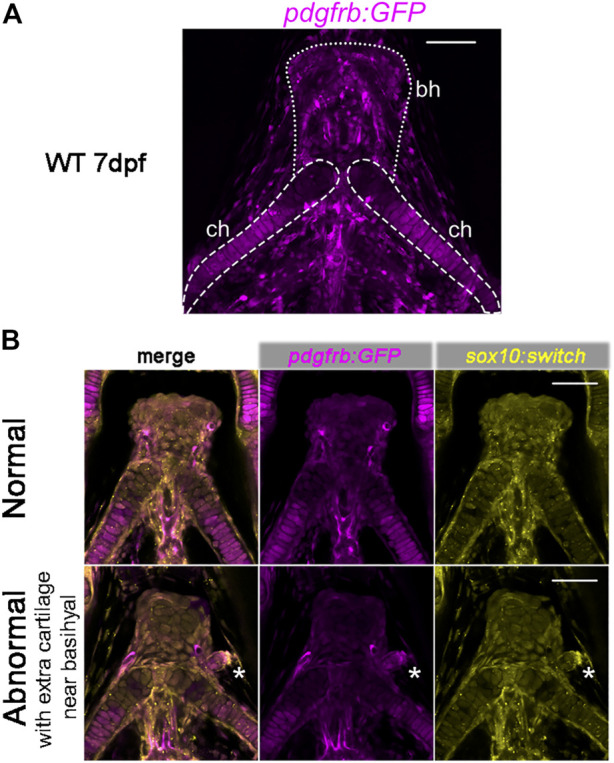
Expression of pdgfrb:GFP in craniofacial cartilages. (A) pdgfrb:GFP (pseudo-colored magenta) expression level is higher in the posterior part of the ceratohyal. 20X confocal stacked images, number of stacks n = 7, interval = 12 µm. (B) Representative images for the normal and abnormal basihyal in chd7 sr5 mutant fish. The abnormal one has extra cartilage near the basihyal cartilage, which expresses more pdgfrb:GFP compared to the basihyal cartilage and the nearby ceratohyal. sox10:switch (pseudo-colored yellow) labels NCCs. The white asterisks mark the extra cartilage. 20X single-slice confocal image. ch: ceratohyal; bh: basihyal (the number of fish with extra cartilage: WT: 0 in 6, chd7 +/sr5 : 1 in 13, and chd7 sr5 : 4 in 14). Scale bar = 50 µm for all images.