
- Title
-
Chromosome segregation fidelity requires microtubule polyglutamylation by the cancer downregulated enzyme TTLL11
- Authors
- Zadra, I., Jimenez-Delgado, S., Anglada-Girotto, M., Segura-Morales, C., Compton, Z.J., Janke, C., Serrano, L., Ruprecht, V., Vernos, I.
- Source
- Full text @ Nat. Commun.
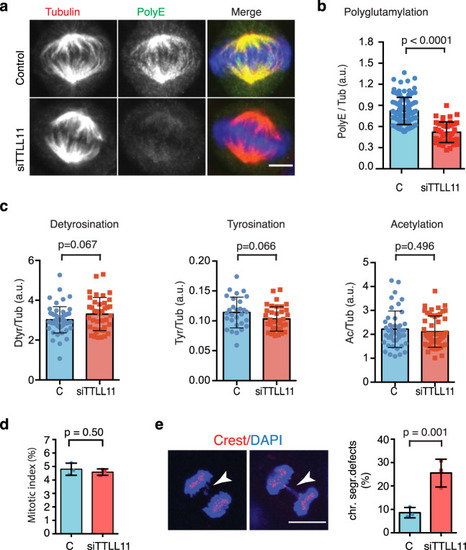
a Immunofluorescence images of metaphase spindles in control and siTTLL11 HeLa cells, showing PolyE (green), tubulin (red) and DNA (blue). Scale bars, 10 μm. b Quantification of the polyE signal normalized to the total tubulin signal in control and siTTLL11 spindles. n (control) = 105 cells and n (siTTLL11) = 50 cells. Graph representative of N = 5 independent experiments. Data are presented as mean values + /− SD. c Quantification of immunofluorescence signal for detyrosinated, tyrosinated and acetylated tubulin normalized to the total tubulin signal in control and siTTLL11 spindles. Detyrosination: n (control) = 55 cells and n (siTTLL11) = 39 cells; Tyrosination: n (control) = 29 cells and n (siTTLL11) = 37 cells. Acetylation: n (control) = 37 cells and n (siTTLL11) = 37 cells. Graphs representative of N = 3 independent experiments. Data are presented as mean values +/− SD. d Mitotic index in control and siTTLL11 cells. n = 1000 cells per condition; N = 3. e Immunofluorescence images of two siTTLL11 anaphase cells showing chromosome segregation defects including a lagging chromosome (white arrows). Kinetochores were labeled with CREST (red) and DNA with DAPI (blue). Quantification of lagging chromosome frequency in control and siTTLL11 anaphase cells. n (control) = 349 and (siTTLL11) = 270 cells examined over N = 3 independent experiments. Scale bar, 15 μm. Data are presented as mean values +/− SD. All P values are based on unpaired two-sided t test with 95% confidence. Source data are provided as a Source Data file. |
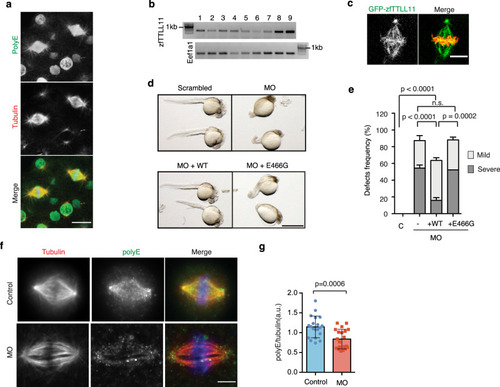
a Immunofluorescence image of a zebrafish embryo (at 4 h post fertilization [hpf]), showing PolyE (green), tubulin (red). Scale bar, 20 μm. Representative image of N = 3 independent experiments. b Semiquantitative RT-PCR showing zfTTLL11 expression in zebrafish embryos. Lanes 1, 4-cell stage; 2, 8-cell stage; 3, 64- cell stage; 4, 256-cell stage; 5, sphere; 6, shield; 7, 70% epiboly; 8, 90% epiboly; and 9, 24 hpf. Eef1a1 was amplified as a control. Representative blot of N = 4 independent experiments. c Fluorescent image of a spindle in a zebrafish embryo expressing GFP-zfTTLL11 (green) and H2B-mCherry (red). Scale bar, 10 μm. Representative image of N = 3 independent experiments. d Zebrafish embryos (36 hpf) injected at the zygote stage with scrambled MO (control), zfTTLL11-Morpholinos (MO), MO and zfTTLL11 mRNA (WT) or MO and catalytically inactive zfTTLL11 (MO + E466G) mRNA. Scale bar, 1 mm. e Cumulative bar plot of developmental defects (severe or mild) in 36-hpf embryos of N = 5 independent experiments, representative of a total of four independent experiments (≥20 embryos scored per condition). ***P < 0.001; ****P < 0.0001; P values are based on a two-tailed χ2 test with a 95% confidence interval. Error bars represent SD. f Immunofluorescence images of metaphase spindles from dissected cells from control and MO zebrafish embryos, showing PolyE (green), tubulin (red), and DNA (blue). Scale bar, 5 μm. g Graph showing the quantification of the polyE signal normalized to the total tubulin signal in control and siTTLL11 spindles. n (control) = 28 cells and n (siTTLL11) = 26 cells. Graph representative of N = 2 independent experiments. Error bars represent SD. The P value is based on unpaired two-sided t test with 95% confidence. Source data are provided as a Source Data file. |

a Selected images from movies of developing zfTTLL11-MO embryos showing several chromosome segregation defects in anaphase cells. Scale bar, 10 µm. b Quantification of anaphase cells with lagging chromosomes in control and morphant embryos expressing zfTTLL11 (+WT) or the catalytically dead zfTTLL11 (+E466G). n (control) = 41 embryos, n (morphant) = 46 embryos, n (+WT) = 39 embryos and n (+E466G) = 31 embryos. The total n is calculated over N = 3 independent experiments. P values based on a two-tailed χ2 test with a 95% confidence interval. Error bars represent SD. c Still images from movies of control and zfTTLL11-MO embryos expressing H2B-mCherry and showing lagging chromosomes forming micronuclei (red arrowheads) in the morphant cells. Time is mm:ss. Scale bar, 20 µm. d Still images from movies of control and zfTTLL11-MO embryos expressing H2B-mCherry and showing micronuclei (orange arrowheads) in the morphant cells. Scale bar, 20 µm. e Quantification from movies of developing zfTTLL11-MO embryos showing at least one event of a lagging chromosome generating a micronucleus at the end of cell division. n (control) = 20 embryos and n (morphant) = 22 embryos coming from N = 3 experiments. Error bars represent the SD. P value based on a two-tailed χ2 test with a 95% confidence interval. Source data are provided as a Source Data file. |
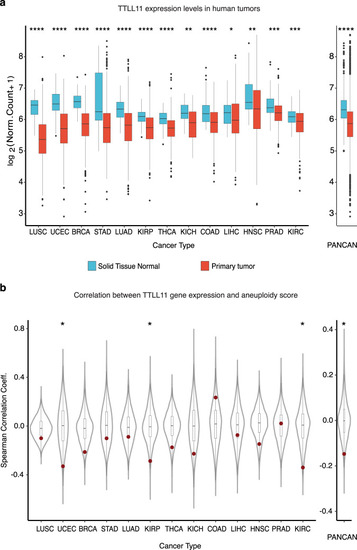
a Normalized expression of TTLL11 in healthy tissues and the corresponding primary tumor samples across 13 different cancer types, separately and combined (PANCAN). Nominal P values: ****P ≤ 0.0001; ***P ≤ 0.001; **P ≤ 0.01; *P ≤ 0.05; based on unmatched two-sided Wilcoxon rank-sum tests. The number of samples per cancer type and sample type (see Supplementary Table 3). In each box plot, the median value is indicated as a horizontal line and the lower and upper bounds of the box correspond to the first- and third quartiles, respectively. The upper- and lower whiskers range from the corresponding box hinges to the largest value no further than 1.5 times the interquartile range from the hinge. All outlying data points beyond the whiskers are plotted individually. b Spearman correlation coefficients of normalized gene expression and sample aneuploidy scores for every gene across 13 different cancer types. PANCAN represents the median correlation coefficient for every gene across cancers. TTLL11 is highlighted in red. Nominal P values: *P ≤ 0.05, based on one-sided, one-sample Z tests. The number of genes detected per cancer type (see Supplementary Table 4). In each box plot, the median value is indicated as a horizontal line and the lower and upper bounds of the box correspond to the first and third quartiles, respectively. The upper- and lower whiskers range from the corresponding box hinges to the largest value no further than 1.5 times the interquartile range from the hinge. All outlying data points beyond the whiskers are plotted individually. |
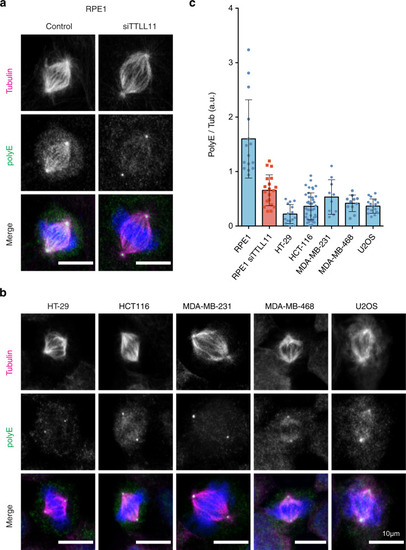
a Immunofluorescence images of metaphase spindles in control and siTTLL11 hTERT-RPE1 untransformed cells, showing the PolyE signal (green), tubulin (red) and DNA (blue). Scale bars, 10 μm. b Immunofluorescence images of metaphase spindles in a panel of cancer cell lines as indicated. The PolyE signal (green), tubulin (red), and DNA (blue) are shown. Scale bars, 10 μm. c Quantification of the polyE signal normalized to the total tubulin signal in spindles from hTERT-RPE1 and cancer cells shown in (b). n (RPE1) = 15 cells, n (RPE1 siTTLL11) = 20 cells, n (HT-29) = 15 cells, n (HCT-116) = 41 cells, n (MDA-MD-231) = 10 cells, n (MDA-MD-468) = 11 cells and n (U2O2) = 17 cells. Data are presented as mean values +/− SD. Source data are provided as a Source Data file. |
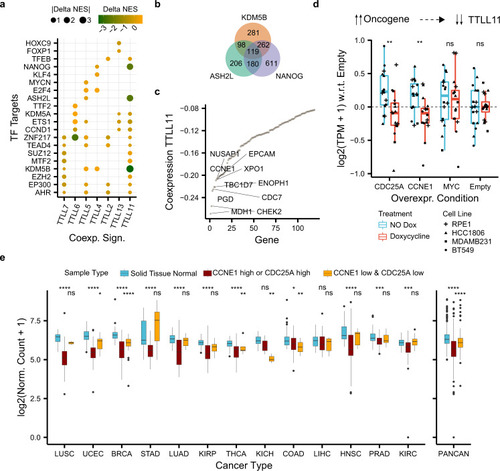
a Differences in normalized enrichment scores (NES) (Delta NES) between the tumor and healthy co-expression signatures (x axis) of each TTLL glutamylase enzyme correlated against the rest of the genes. NES were obtained through gene-set enrichment analysis (GSEA) and show whether a co-expression profile is significantly enriched (FDR < 0.05) in genes targeted by a transcription factor (y axis) from the ChIP-seq-based ChEA dataset24). b Overlap between enriched transcription factor targets coexpressing with TTLL11 in tumors. c Co-expression (y axis) between TTLL11 and enriched 119 transcription factor targets of KDM5B, ASH2L, and NANOG in tumors (x axis). d Normalized gene expression of TTLL11 with respect to the control (“Empty”) condition (y axis) upon overexpression with doxycycline (“Treatment” color) of different oncogenes (x-axis) across four different cell models (“Cell Line” dot shape). Each condition and treatment contain N = 16 biologically independent experiments (four for each cancer cell line). In each box plot, the median value is indicated as a horizontal line and the lower and upper bounds of the box correspond to the first and third quartiles, respectively. The upper and lower whiskers range from the corresponding box hinges to the largest value no further than 1.5 times the interquartile range from the hinge. All outlying data points beyond the whiskers are plotted individually. e Normalized expression of TTLL11 (y axis) in healthy solid tissues and the corresponding primary tumor samples stratified by the expression of CCNE1 and CDC25A (“Sample Type” color) across 13 different cancer types (x axis), separately and combined (PANCAN). Statistical tests compare healthy solid tissues against either samples with high expression of CCNE1 or CDC25A (“CCNE1_high or CDC25_high”) or samples with low expression of both upstream regulators of TTLL11 (“CCNE1_low & CDC25A_low”). Number of samples per cancer type and sample type (see Supplementary Table 5) In each box plot, the median value is indicated as a horizontal line and the lower- and upper bounds of the box correspond to the first- and third quartiles, respectively. The upper and lower whiskers range from the corresponding box hinges to the largest value no further than 1.5 times the interquartile range from the hinge. All outlying data points beyond the whiskers are plotted individually. In all the figure, nominal P values: ****≤0.0001, ***≤0.001, **≤0.01, *≤0.05, based on unmatched two-sided Wilcox rank-sum tests. |

a Quantification of the spindle length and width in control or siTTLL11 HeLa cells. Length: n (control) = 55 cells and n (siTTLL11) = 45 cells. Width: n (control) = 47 cells and n (siTTLL11) = 47 cells. Graphs show one representative experiment of N = 4 independent experiments. Data are presented as mean values +/− SD. b Quantification of the spindle length in control and siTTLL11 hTERT-RPE1 cells. n (control) = 53 cells and n (siTTLL11) = 53 cells. Graphs show one representative experiment of N = 3 independent experiments. Data are presented as mean values +/− SD. c Quantification of the spindle length in control and MO-1 zebrafish embryo dissected cells. n (control) = 28 cells and n (MO) = 26 cells. Graphs show one representative experiment of N = 2 independent experiments. Data are presented as mean values + /− SD. d Quantification of cold-induced K-fibers depolymerization over time in control and siTTLL11 cells. Cells were classified into four categories as shown. n (control[0]) = 100 cells, n (control[5]) = 87 cells, n (control[10]) = 87 cells, n (siTTLL11[0]) = 100 cells, n (siTTLL11[5]) = 105 cells and n (siTTLL11[10]) = 115 cells. P values based on χ2 test with a 95% confidence interval. Scale bar, 15 μm. e Immunofluorescence image of metaphase plate aligned chromosomes in HeLa cells, showing chromosomes (blue), CREST (magenta, kinetochore), and Hec1 (yellow). In the magnification, the white arrow shows the measured interkinetochore distance. Scale bar, 5 μm; for zoom, 2 μm. Quantification of interkinetochore distance. For si-control, n = 72 kinetochore pairs, from 16 cells; for siTTLL11, n = 82 kinetochore pairs, from 18 cells. Scale bar, 5 μm; in zoom, 2 μm. f Confocal images of tubulin photoactivated (dark gray) close to the metaphase spindle equator (0 min) over time (min) in control or siTTLL11 cells. The velocity of the poleward flux in control cells (n = 18) and siTTLL11 cells (n = 14). Scale bar, 15 μm. All graphs correspond to three independent experiments. Data are presented as mean values +/− SD. Unless otherwise indicated P values are based on an unpaired two-sided t test with 95% confidence. Source data are provided as a Source Data file. PHENOTYPE:
|

ZFIN is incorporating published figure images and captions as part of an ongoing project. Figures from some publications have not yet been curated, or are not available for display because of copyright restrictions. |