
Fig. 5
- ID
- ZDB-FIG-221211-202
- Publication
- Zadra et al., 2022 - Chromosome segregation fidelity requires microtubule polyglutamylation by the cancer downregulated enzyme TTLL11
- Other Figures
- All Figure Page
- Back to All Figure Page
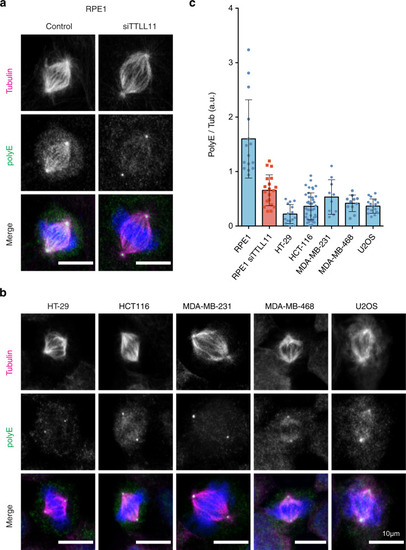
a Immunofluorescence images of metaphase spindles in control and siTTLL11 hTERT-RPE1 untransformed cells, showing the PolyE signal (green), tubulin (red) and DNA (blue). Scale bars, 10 μm. b Immunofluorescence images of metaphase spindles in a panel of cancer cell lines as indicated. The PolyE signal (green), tubulin (red), and DNA (blue) are shown. Scale bars, 10 μm. c Quantification of the polyE signal normalized to the total tubulin signal in spindles from hTERT-RPE1 and cancer cells shown in (b). n (RPE1) = 15 cells, n (RPE1 siTTLL11) = 20 cells, n (HT-29) = 15 cells, n (HCT-116) = 41 cells, n (MDA-MD-231) = 10 cells, n (MDA-MD-468) = 11 cells and n (U2O2) = 17 cells. Data are presented as mean values +/− SD. Source data are provided as a Source Data file. |